
Edge Solutions
The ITM Edge Platform — From Node to Decision
“Analytics at every altitude: on the node, at the edge, and in the cloud — most vendors give you one.”
Five layers turn wireless sensors into decisions. Generic IoT vendors move raw data; ITM moves interpretation.
Connectivity — gateways, routers and device management
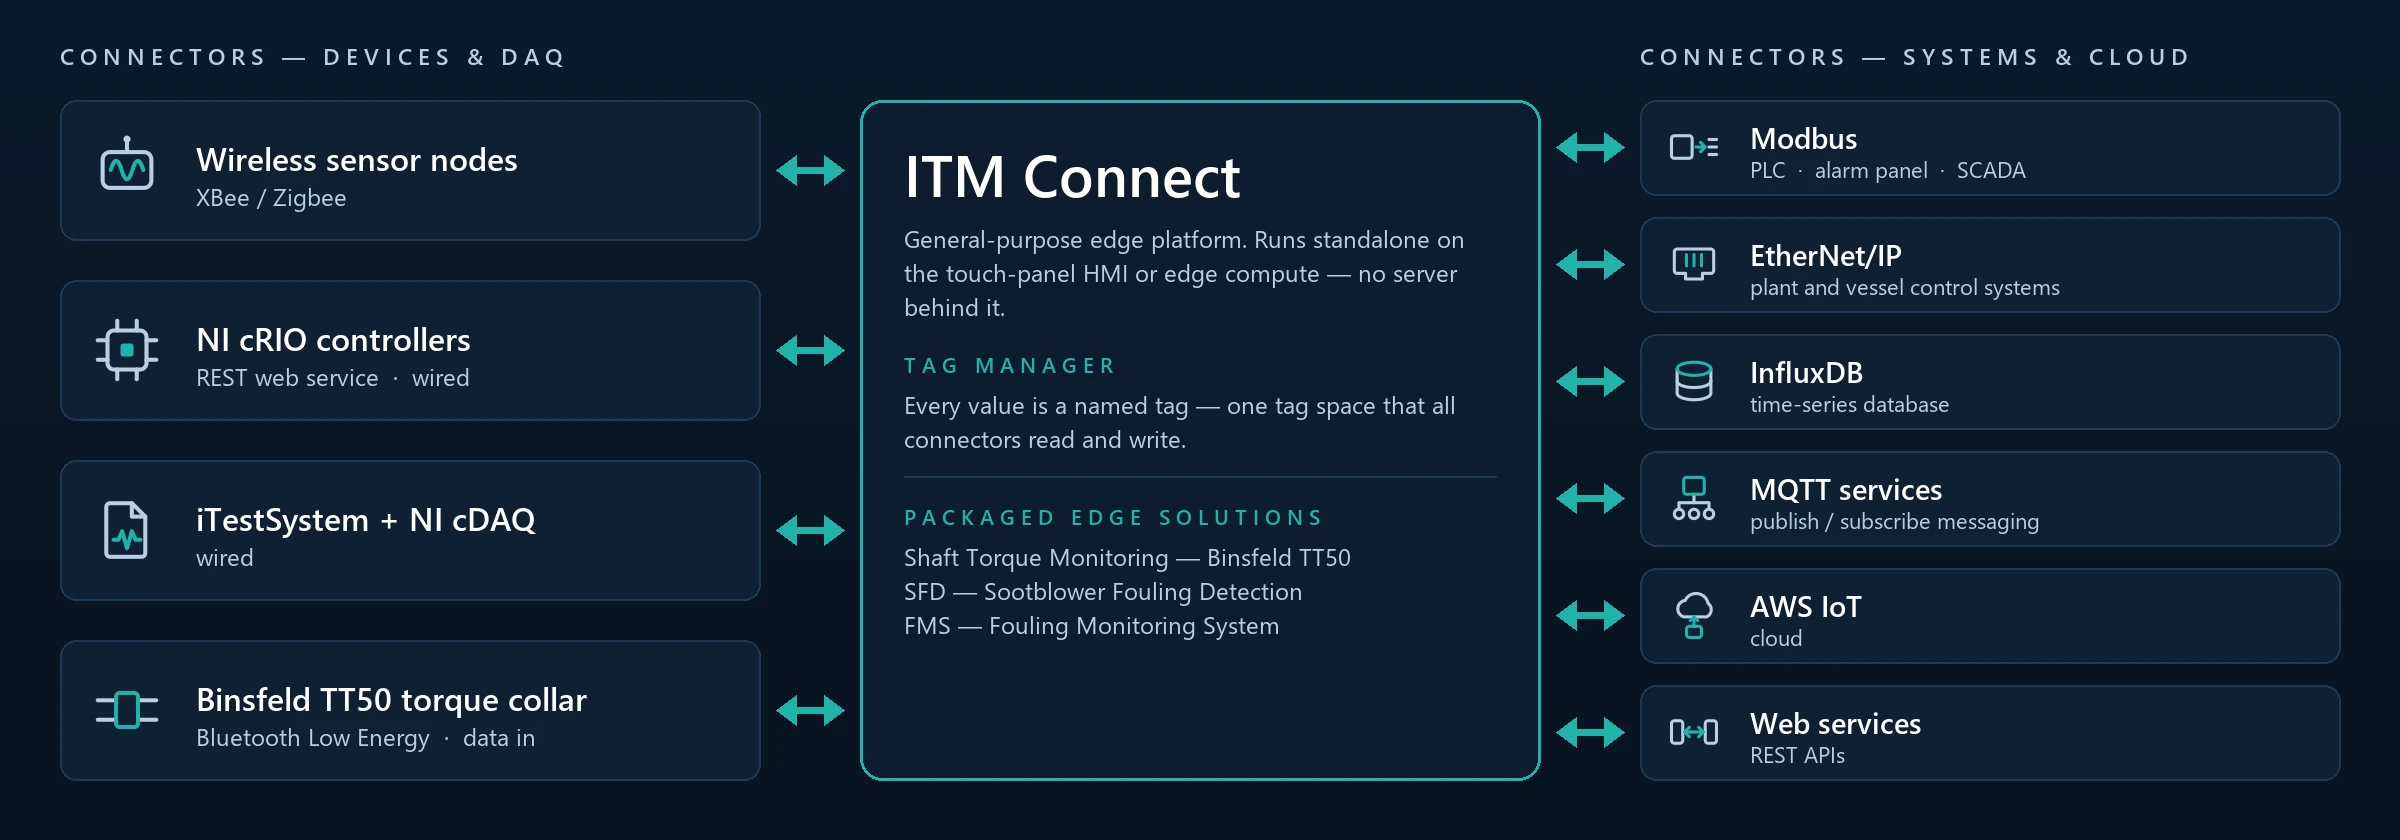
“Every node onboarded, secured, buffered, and speaking plant language.”
- One gateway aggregates the whole mesh — provisioning, security, and device management handled by the platform, not the customer’s IT team.
- Data buffering plus over-the-air updates: no site visit for firmware, no data loss on network hiccups.
- Hybrid by design — wired NI cDAQ/cRIO channels join wireless nodes in one unified system.
Scope: Wireless IoT Gateway + Wireless Routers; MQTT, OPC UA, HTTPS/REST, Modbus, OSIsoft PI; wireless, wired, or hybrid architectures.
Every Packaged Solution ships on this backbone.
Analytics — FFT, anomaly detection and failure forecasting
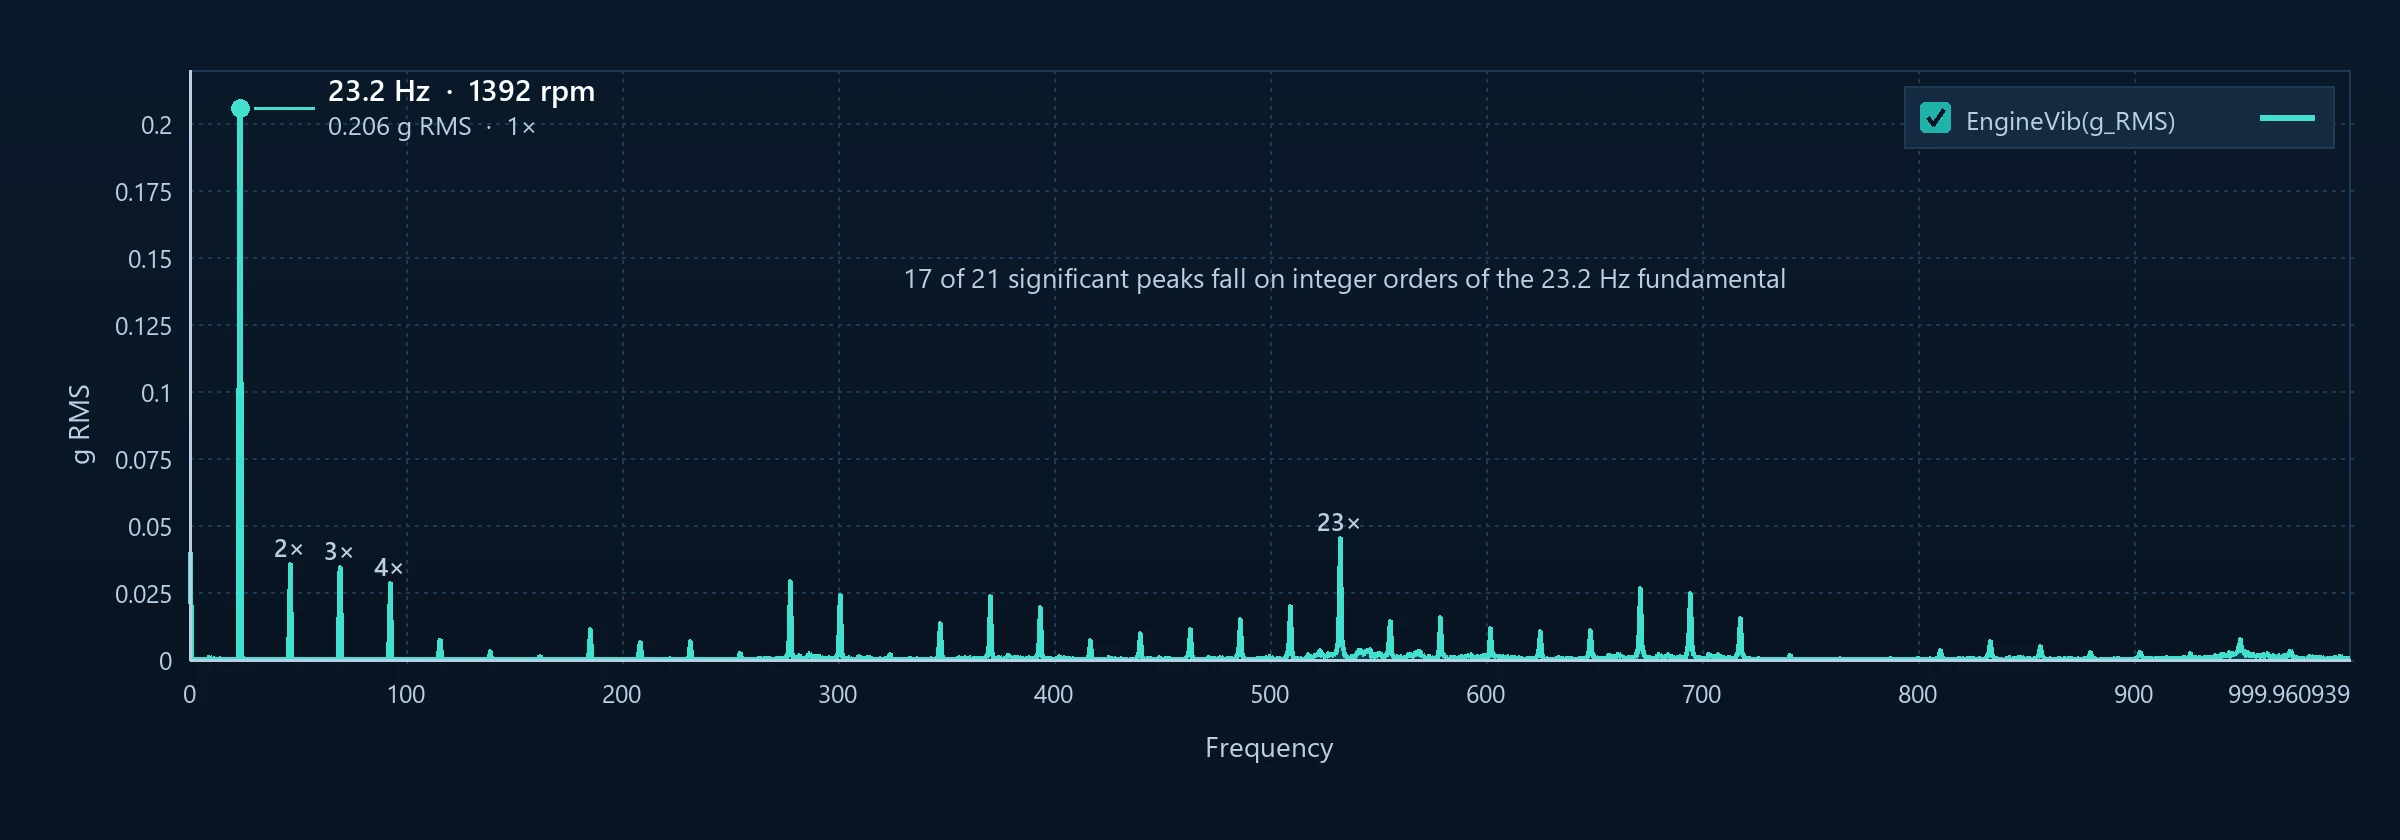
“Analytics at every altitude: on the node, at the edge, and in the cloud — most vendors give you one.”
- On the node: processed features at the source — vibration band KPIs, interrupt-triggered capture — so batteries last and data means something.
- At the edge: FFT, filtering, thresholds, and event classification on the on-site compute — answers in seconds, even offline.
- In the cloud: anomaly detection, failure forecasting, and AI/ML (AWS) trained on ITM’s measurement heritage.
- Generic IoT vendors move raw data; ITM moves interpretation — built on 20+ years of knowing what the signal means.
Scope: FFT & filtering; anomaly detection on strain trends; event classification; failure forecasting & adaptive thresholds; iTestSystem Automated Analytics + AWS.
The same analytics engine behind FMS fouling indexes, SFD effectiveness scores, and BOLT inventory.
Insights — dashboards, KPIs & alarms
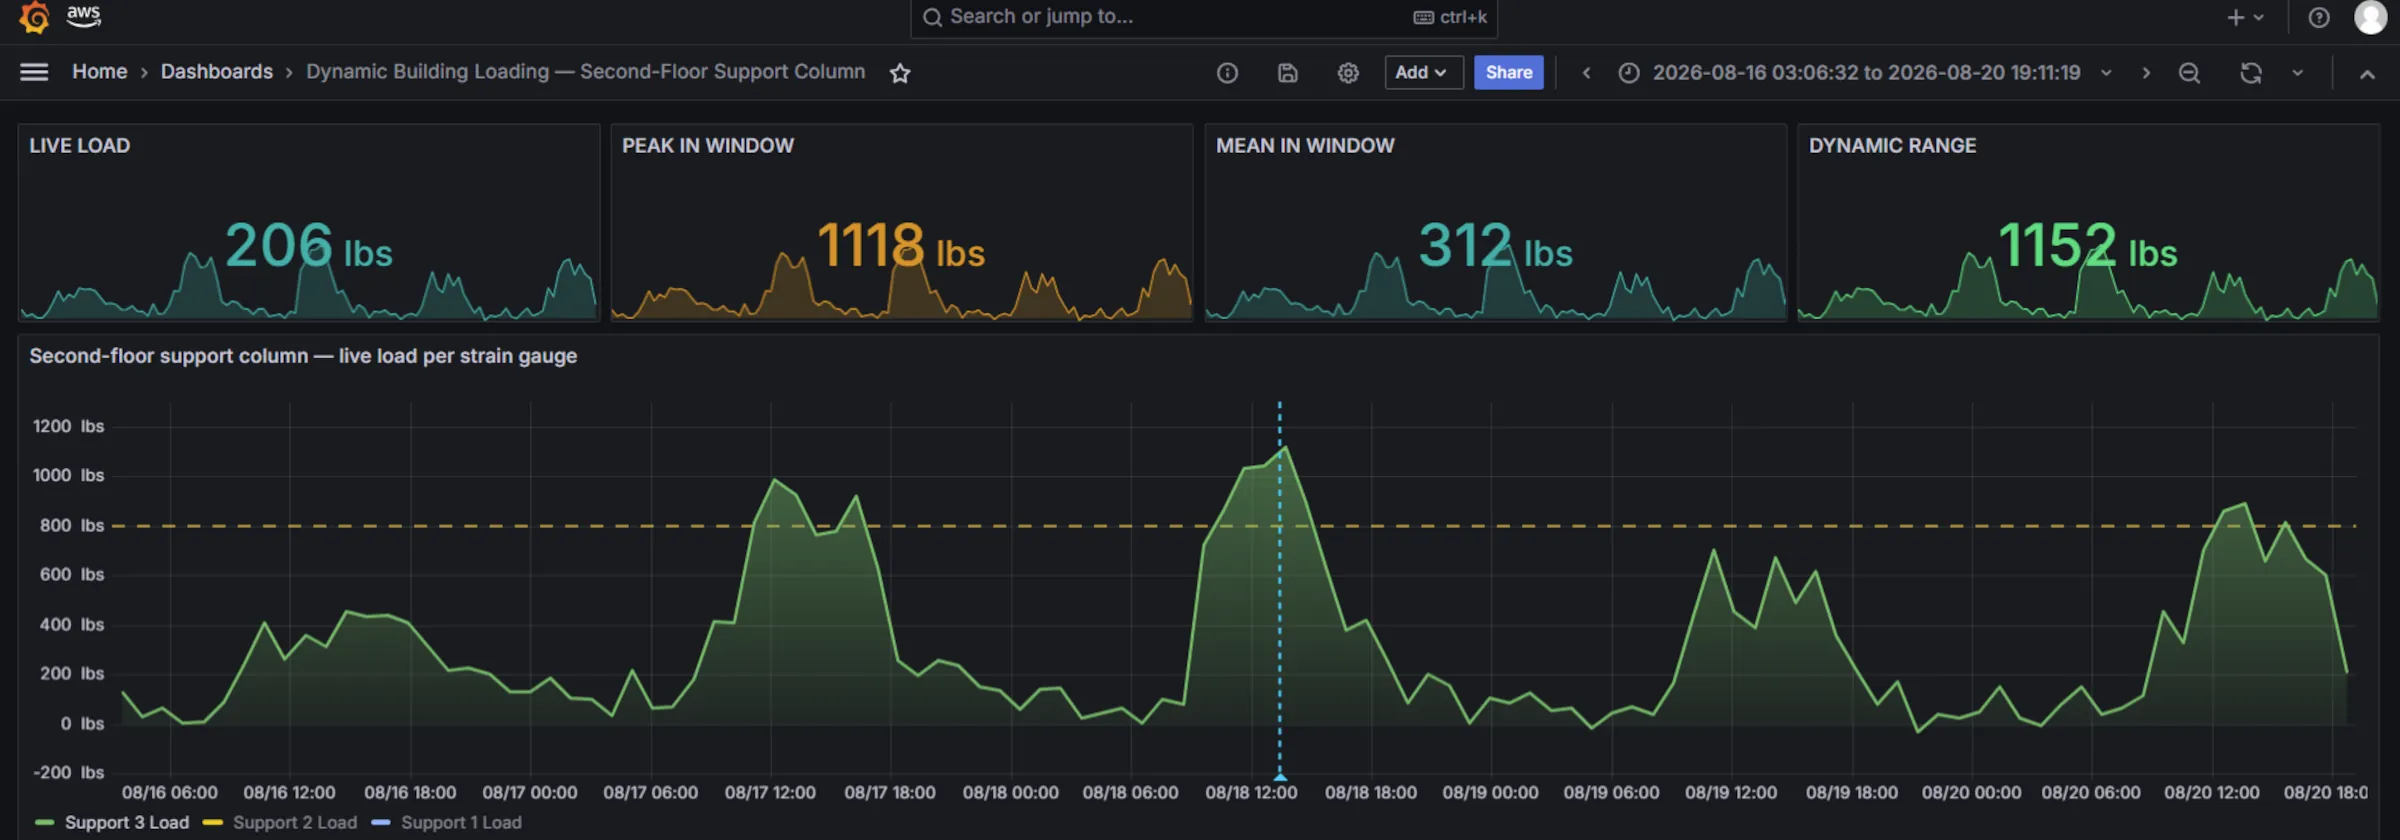
“Users see the measurement that matters against a threshold — not raw data. Decisions, on one screen.”
- Role-specific views: operator dashboards, engineering detail, management summaries.
- KPIs, trend charts, and alarm notifications delivered as a web app over secured VPN.
- Grafana-based: familiar, brandable, and fast to extend.
Scope: Operator/engineering/management tiers; KPI & trend visualization; alarm delivery; contextual reporting.
The dashboard is what the customer shows their boss.
Compute — the on-site brain
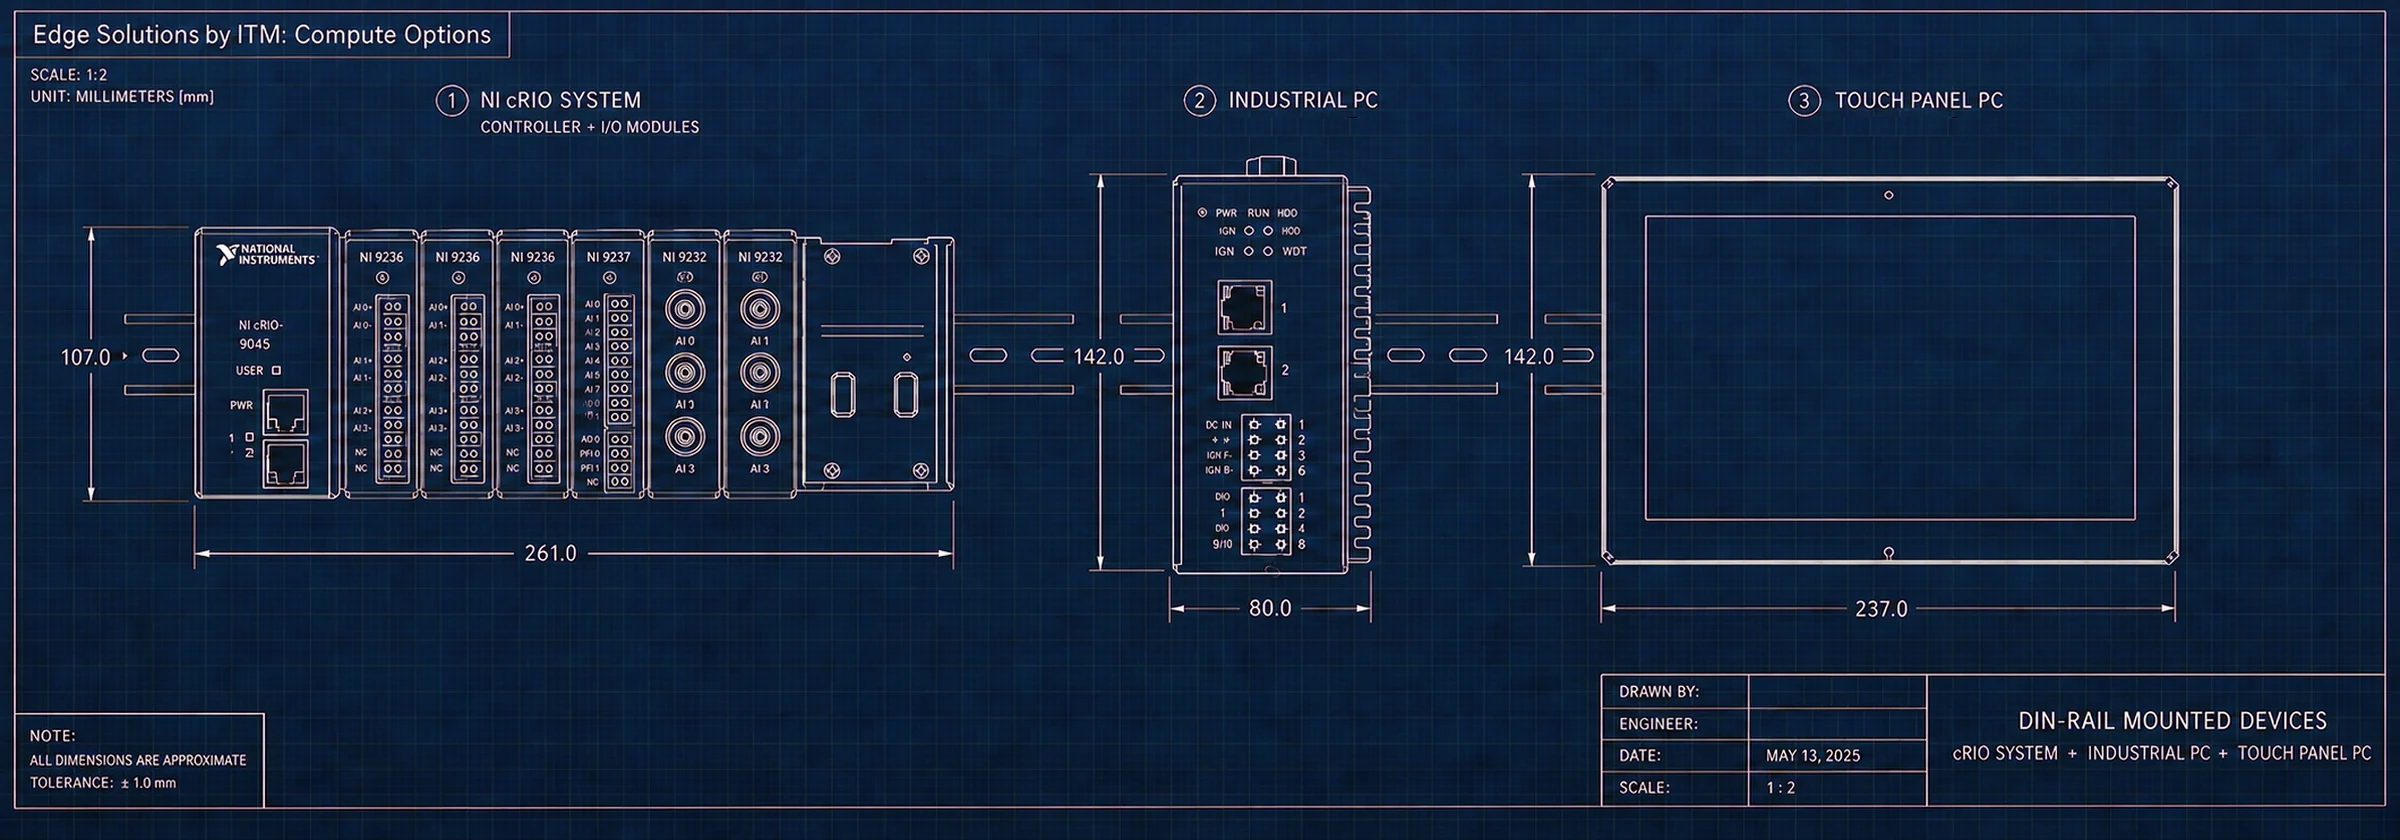
“Analytics, dashboards, and node management in one industrial box.”
- Runs the analytics on site — insight keeps flowing when the internet doesn’t.
- Standalone unit or embedded inside the Wireless IoT Gateway enclosure.
- Compresses high-speed data at the source: ship answers upstream, not terabytes.
Scope: Industrial-PC or Raspberry-Pi-class; runs the analytics, the dashboards and ITM Connect; plant network or cloud (AWS); outputs Modbus, alarms, dashboards, historians.
The conduit between the gateways and every dashboard a customer sees.
ITM Connect — on-site configuration web app
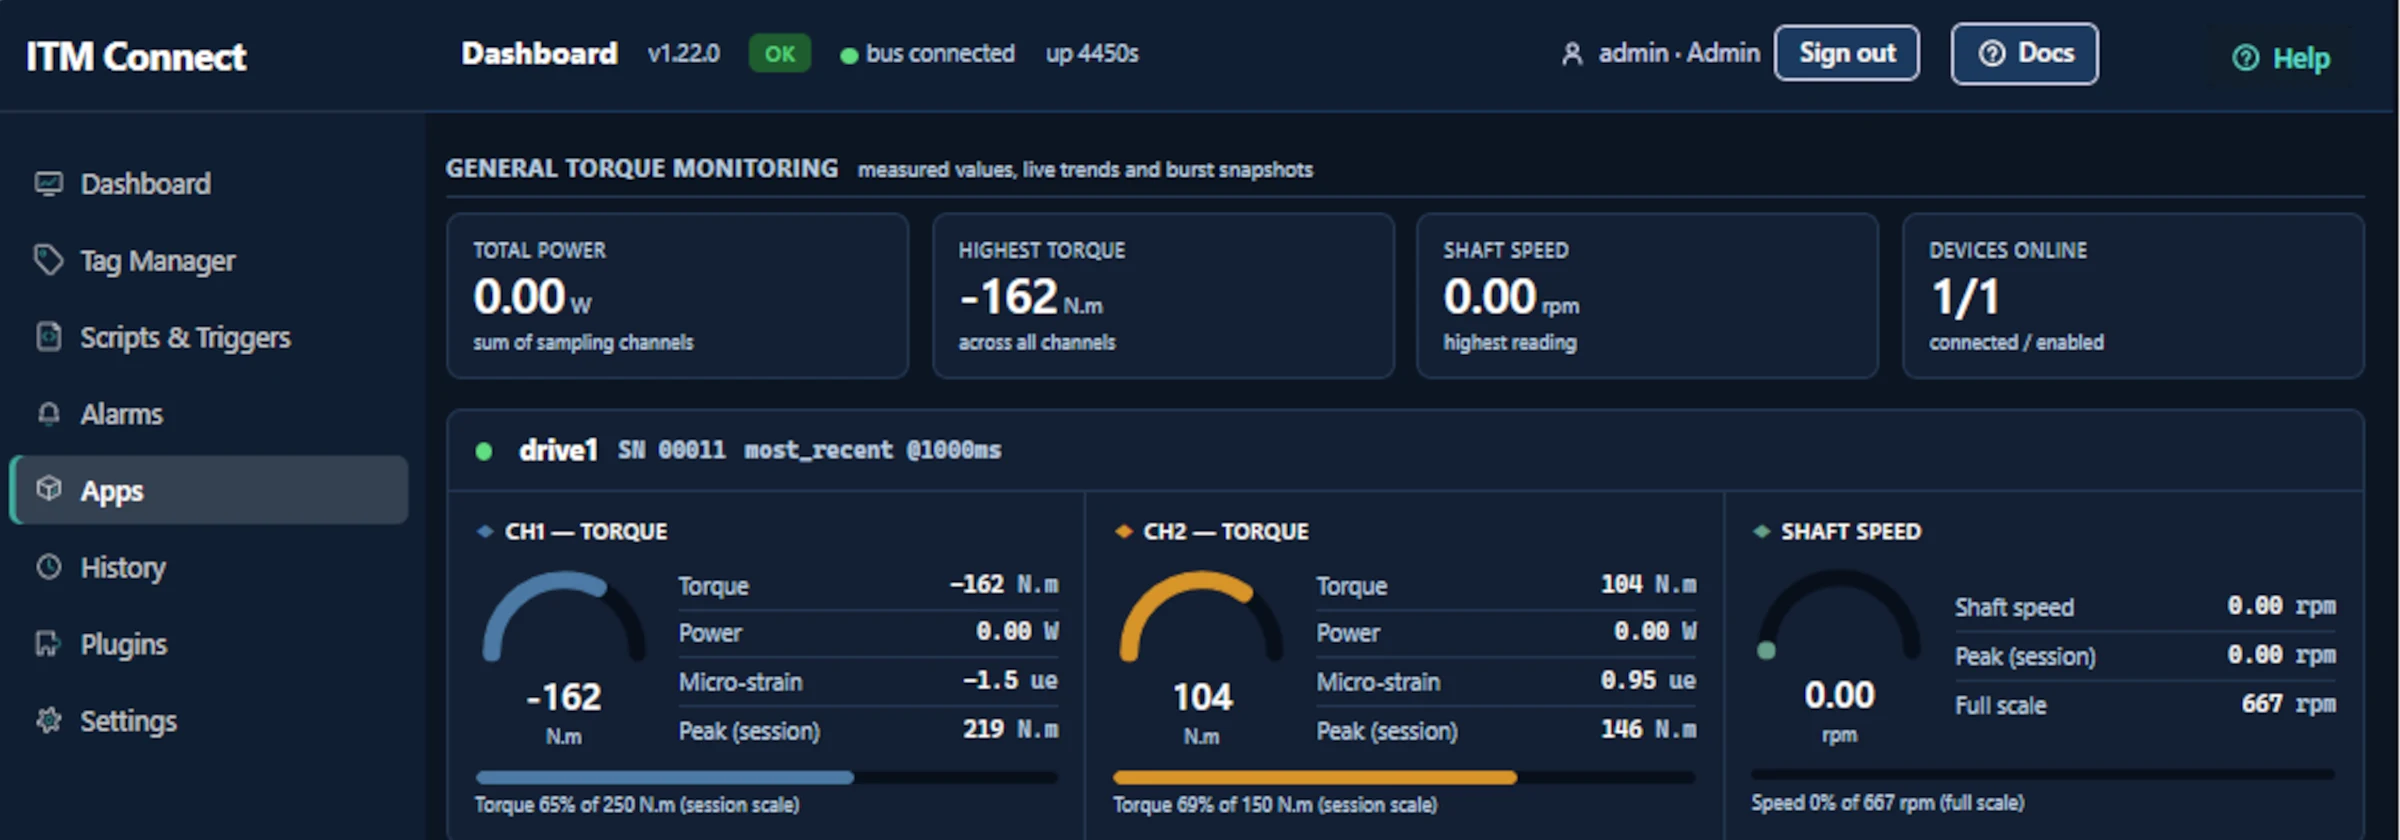
“The web app that makes the customer self-sufficient — configure, monitor, and route data on site.”
- Configure Edge Nodes and their inputs from a browser — no ITM site visit, no command line.
- Node-health monitoring at a glance: batteries, signal, last report, across the whole mesh.
- Customer-configurable Modbus data and alarm outputs — plant integration without a project.
Scope: ITM web app on the on-site compute; configures nodes, inputs, sampling, alarms; monitors node health & network status; hosts generic + Packaged Solution dashboards.
Standard on every on-site compute deployment.
Next step: see what runs on it.
Talk to an engineer: (844) 837-8797 · info@iTestSystem.com
Related Edge Solutions resources
-
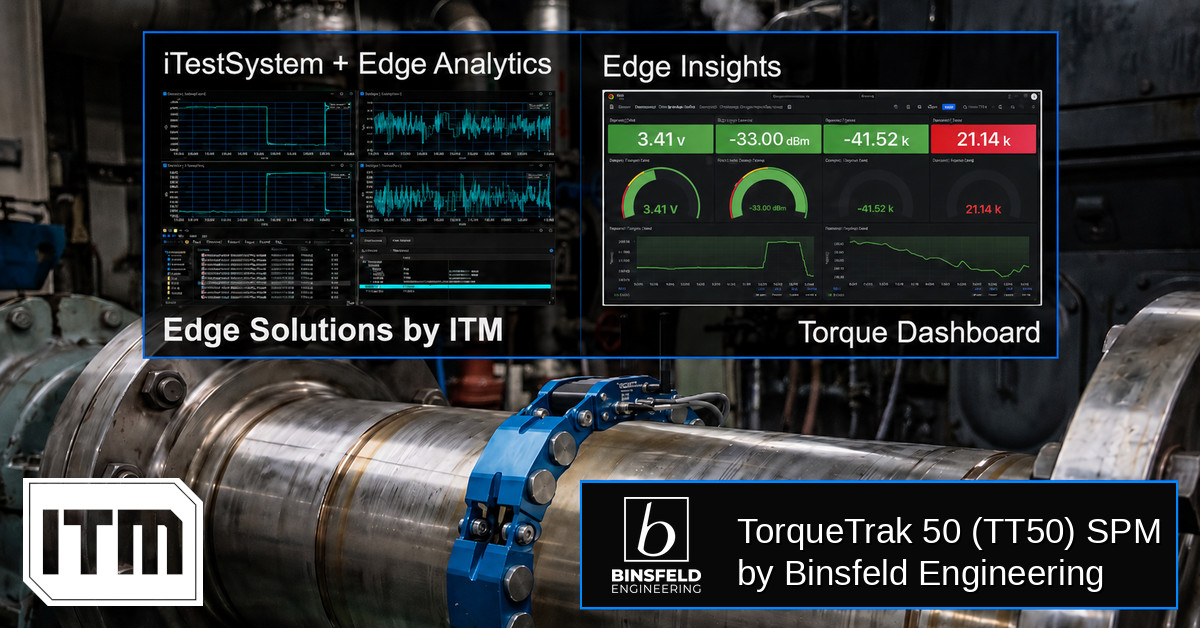
Torque-based Edge Insights: ITM iTestSystem Automated Analytics + Binsfeld TT50
In industrial and marine environments, the drivetrain is often the most critical — and least monitored — part of the system. Rotating shafts transferring torque through gearboxes, couplings, and propellers generate enormous forces that, left unmeasured, become the root cause of unexpected failures, unplanned downtime, and costly maintenance cycles. Traditional torque measurement solutions require shaft…
-
 Ash Hopper Monitoring, Boiler Monitoring, Condition Monitoring, Edge Solutions, Industrial Data Acquisition, industrial IoT, Industrial Monitoring, Power Plant Monitoring, Predictive Maintenance, Recovery Boiler, sootblower monitoring, Strain Gauge Monitoring, Thermocouple Monitoring, vibration monitoring, Wireless Monitoring
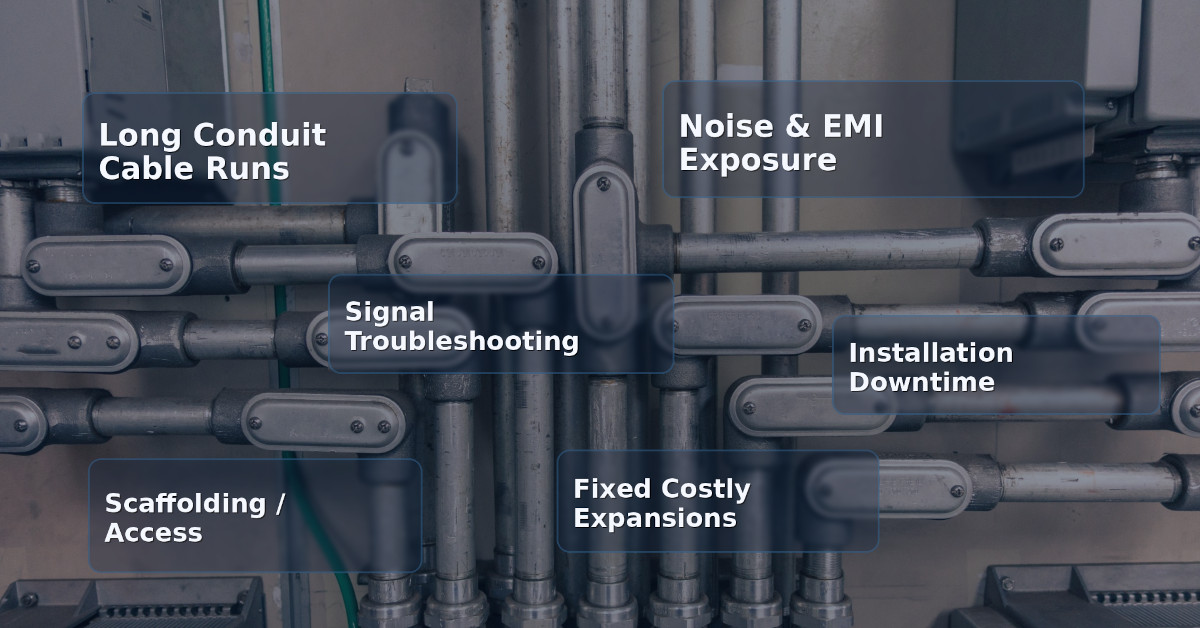
Hardwired vs. Wireless Industrial Monitoring: When Does Wireless Actually Make Sense?
For decades, hardwired data acquisition has been the default standard for industrial monitoring. From strain gauges on structural supports to thermocouples in recovery boilers, running conduit and pulling cable has been considered the “safe”…
-
 Boiler Efficiency, boiler safety, Edge Solutions, intelligent boiler cleaning, ITM monitoring systems, Predictive Maintenance, sootblower monitoring
Smarter Cleaning, Safer Boilers with ITM’s Monitoring Systems
The Business Case for ITM’s Sootblower Intelligent Maintenance and Fouling-Directed Cleaning Solutions Executive Summary Sootblowers are essential for keeping recovery, biomass, and power boilers clean and efficient. However, without proper monitoring and maintenance, they can become hidden sources of steam waste, mechanical failures, and even safety risks. Integrated Test and Measurement (ITM) has developed the…