
Edge Solutions
Structural Load Monitoring — Wireless Strain Nodes + ITM Connect
“Continuous load visibility on the structures you can least afford to lose.”
SLM — Structural Load Monitoring
- Measures the load in the steel itself — bonded strain gauges turn a beam, leg or column into a load sensor.
- No load cells and no shutdown: gauges bond to the supports already there, and the vessel stays closed.
- Live load, percent of capacity and high-load alarms for every structure — buildup is caught before it becomes overload.
- Scales from one structure to the plant on a wireless mesh, with results in the PLC, SCADA and historian.
Load Monitoring App
Every structure carries its load through steel, and the strain in that steel is proportional to the load. Strain gauges bonded to the existing supports, read by ITM Wireless Strain Nodes, measure it continuously — more accurately than bolt-on sensors and at lower cost than retrofitting load cells. The Load Monitoring App is what turns that strain into a plant signal. Running on ITM Connect at the edge, it scales each structure’s gauges to load, compares the load with rated capacity, and does three things with the result at once: shows every structure on one screen, trends it and raises high-load alarms, and serves the same numbers to the plant network.
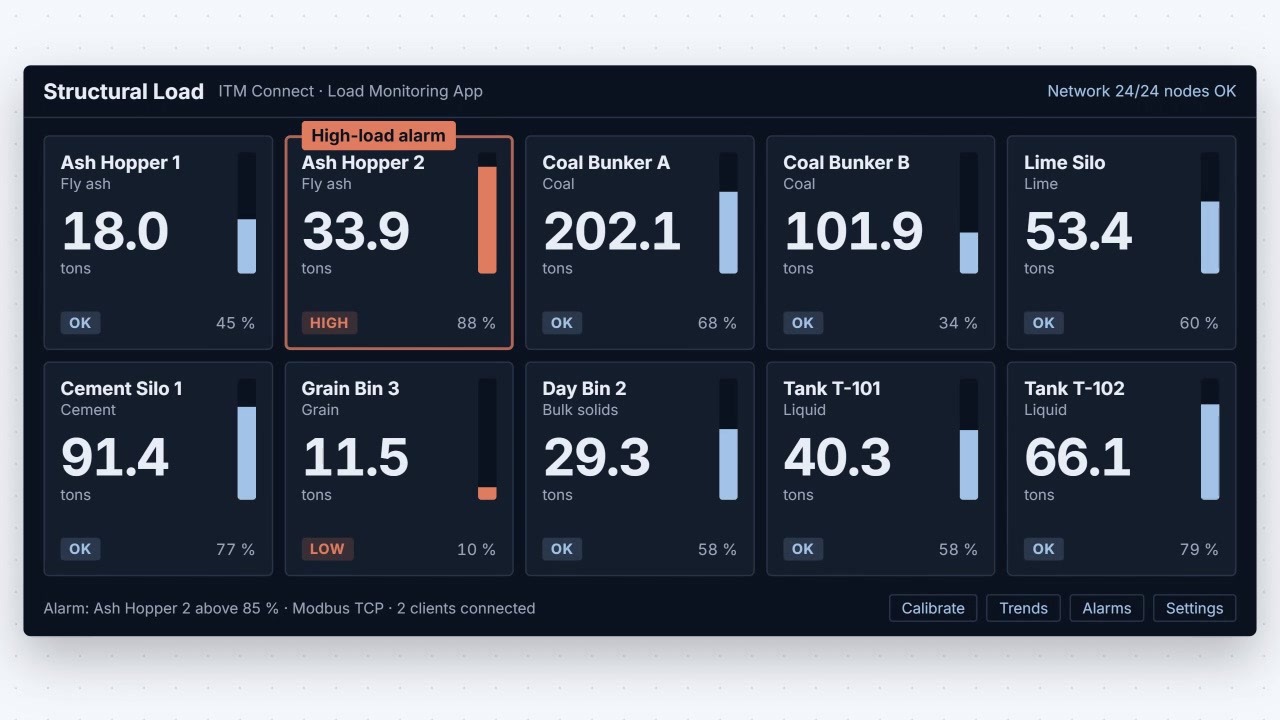
- Every structure on one screen — load, percent of rated capacity and status for each structure, in a browser on the plant network.
- High-load alarms — an alarm limit on each structure flags a load approaching rated capacity while there is still time to act.
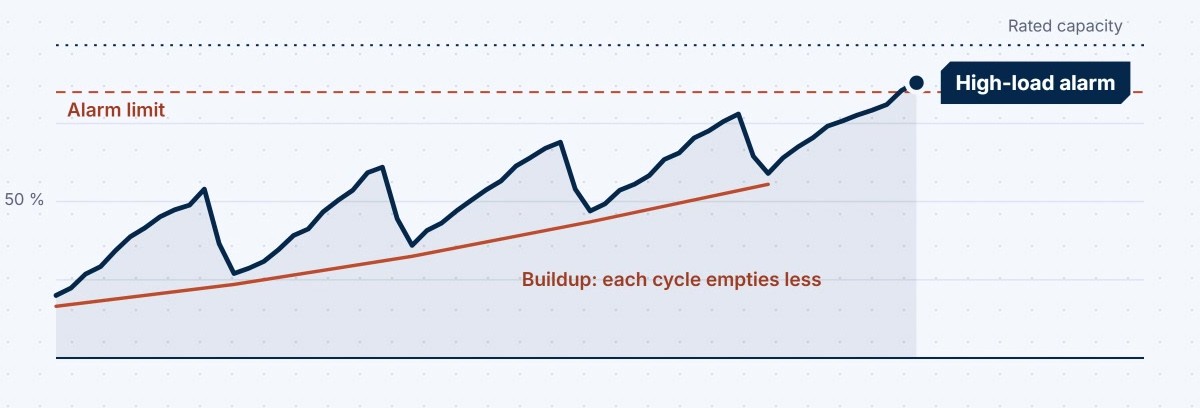
- Trending and failure analysis — load history shows buildup that each cycle fails to empty, and gives the record needed after an event.
- Overload events — detection and classification catch the overload the shift report misses.
- Publishes it to the plant — Modbus TCP, EtherNet/IP and Modbus RTU over RS-485, with a cloud-connected option for dashboards across sites.
- Grows with the site — each structure keeps its own calibration and capacity. Start with one structure, then add the rest.
At a glance: Quarter, half or full-bridge strain plus temperature · 24-bit · 1 sample per day to 10 samples per second · 2.4 GHz Zigbee mesh · battery or field-cable powered · environmentally sealed gauges · Modbus TCP, EtherNet/IP, Modbus RTU.
Bonded gauges are the differentiator. A gauge bonded to the steel reads the strain in the load path directly, which makes it more accurate than a bolt-on sensor and far less work than cutting in load cells. Nothing is lifted, emptied or opened, and nobody takes a manual measurement. Sealed for long-term service, the same gauges that report today’s load also show the slow trend — the hopper or bin that empties a little less each cycle — before it becomes an overload.
One method. Any loaded structure.
Where the gauges go depends on how the structure carries its load. The same wireless strain node, the same mesh and the same app monitor a vessel on legs, a beam or a frame — so the question is not whether the structure can be measured, but which load you cannot afford to miss. For bulk inventory by weight, see Silo Weight Monitoring, the packaged version of the same method.
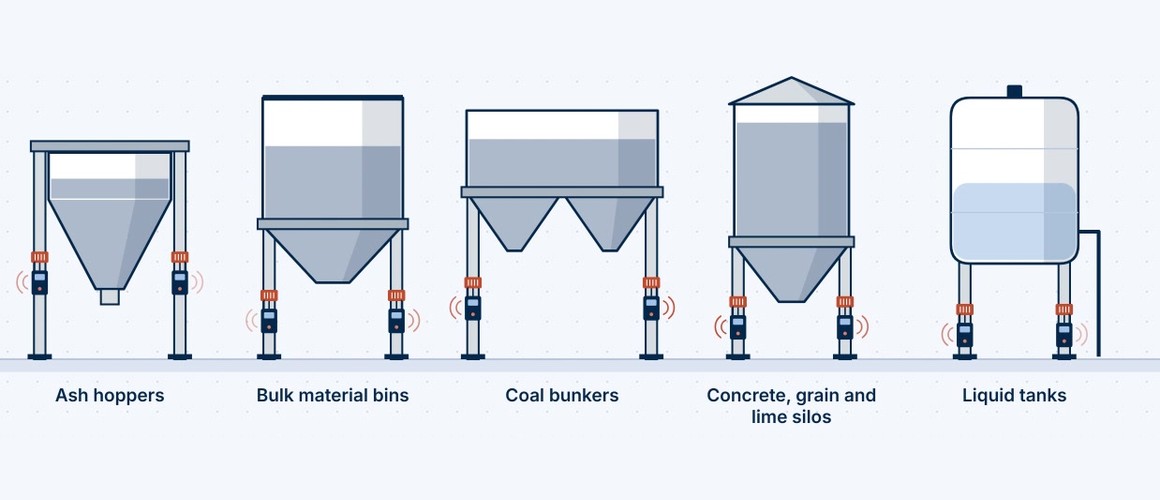
Vessels on their supports
Hoppers, bins, bunkers, silos and tanks stand on legs, columns or a skirt. Gauges on those supports report the load of the vessel and everything in it, without opening it.
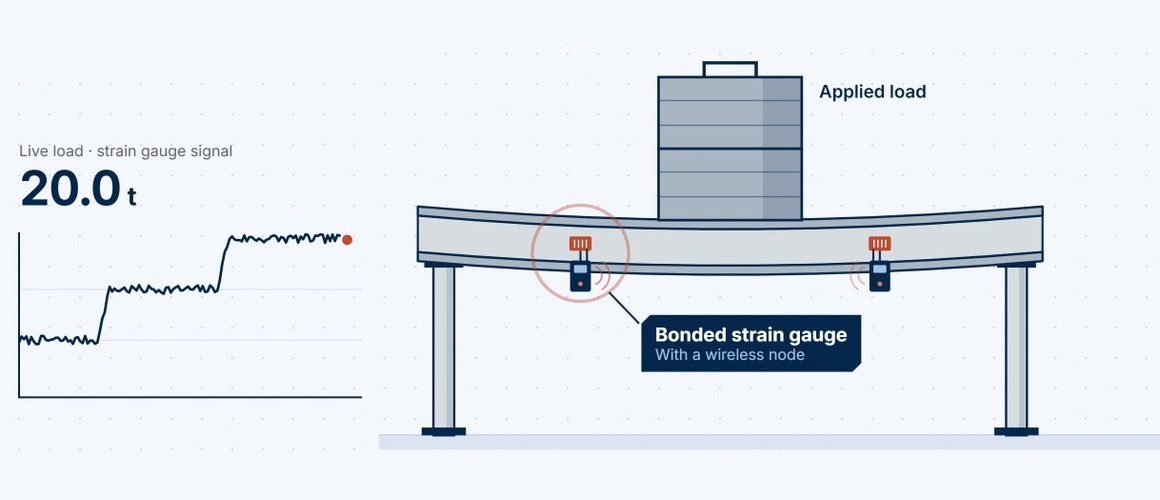
Beams, frames and columns
A bonded gauge turns a single structural member into a load sensor. Arrays of wireless strain nodes on the load path show how a frame shares its load, and when one member takes more than it should.
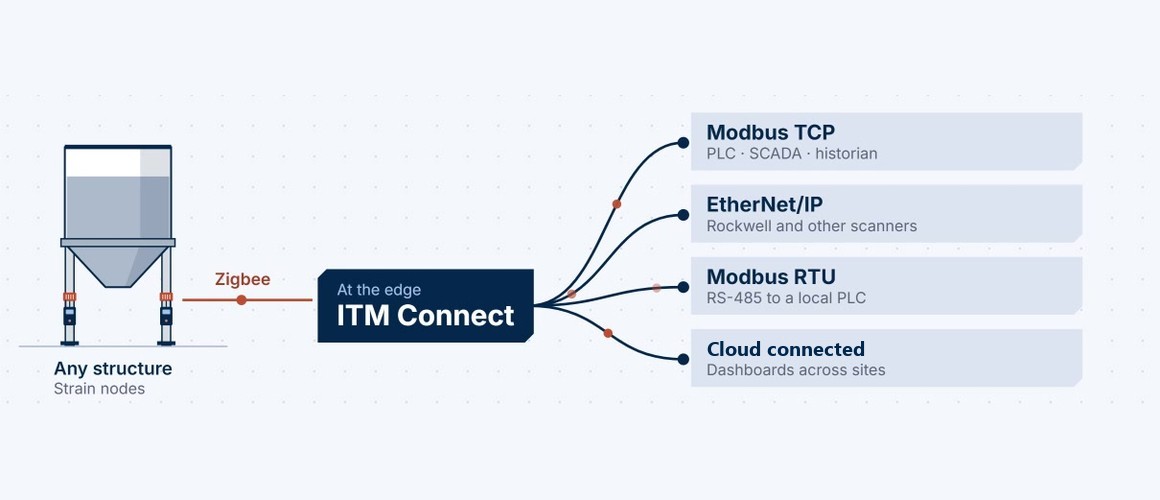
One network for the site
Nodes join a 2.4 GHz Zigbee mesh and report to ITM Connect at the edge. From there the loads go to the plant over the protocols it already uses.
Built on ITM’s structural testing and strain heritage since 2001 — permanent strain instrumentation engineered by the team that installs it.
Next step: start with one structure, then add the rest.
Talk to an engineer: (844) 837-8797 · info@iTestSystem.com
Related Edge Solutions resources
-
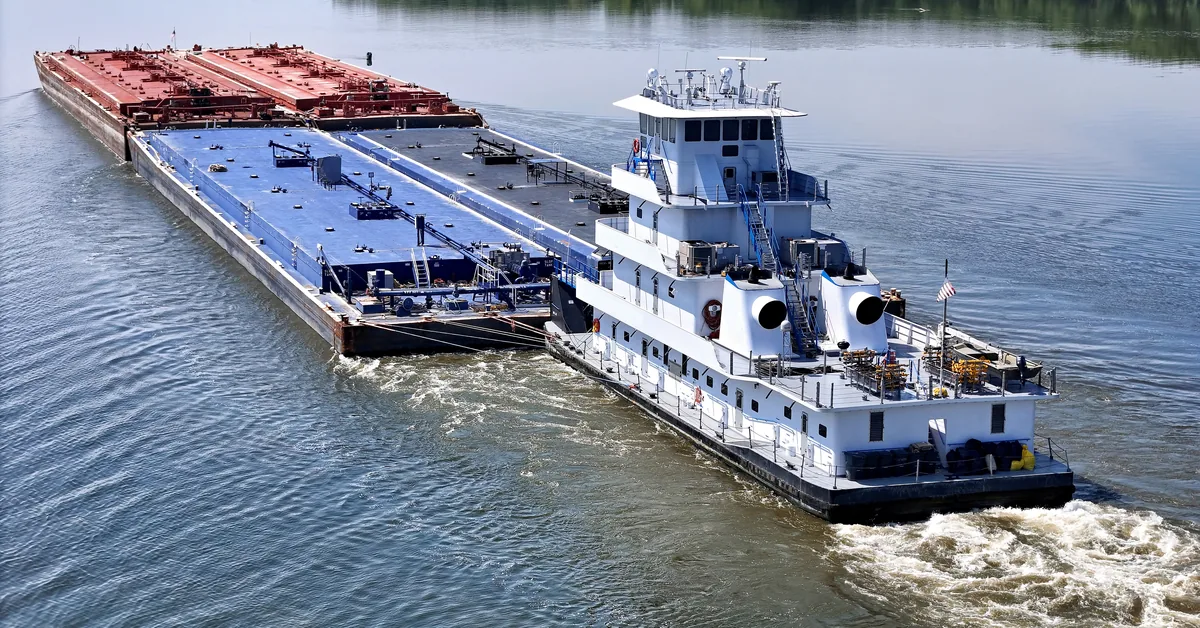
Wireless Torque. Connected Fleet. Meet ITM at the International WorkBoat Show 2026
Visit ITM at the International WorkBoat Show in New Orleans, Dec. 2–4, 2026, and see how ITM Connect turns shaft torque into insight for one vessel or a fleet.
-
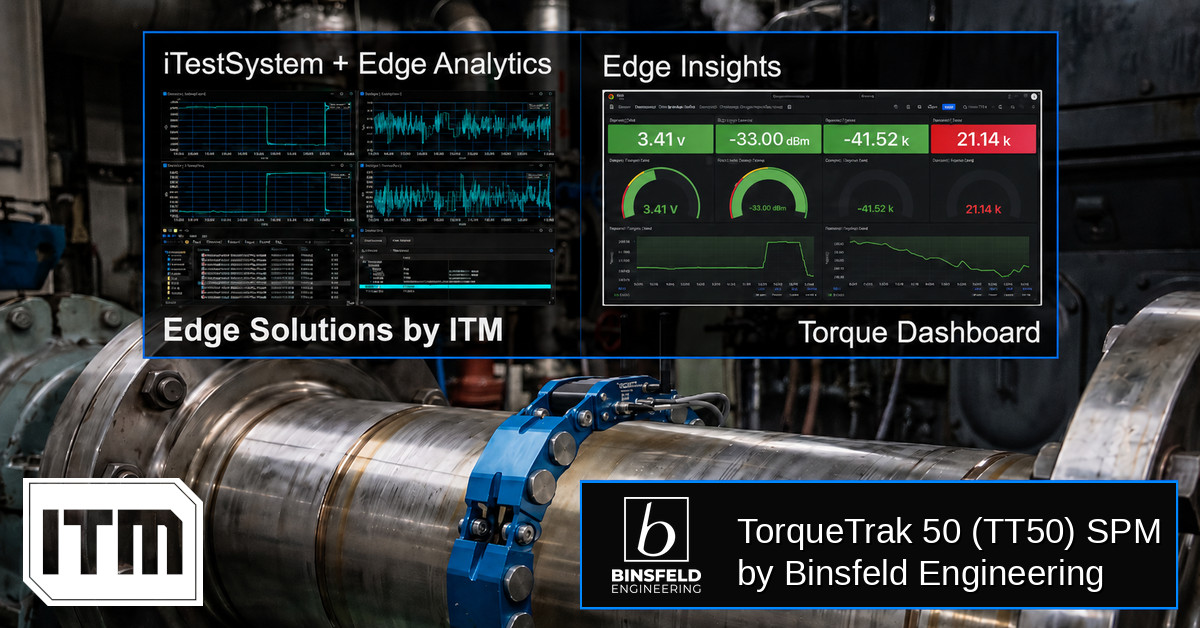
Torque-based Edge Insights: ITM iTestSystem Automated Analytics + Binsfeld TT50
In industrial and marine environments, the drivetrain is often the most critical — and least monitored — part of the system. Rotating shafts transferring torque through gearboxes, couplings, and propellers generate enormous forces that, left unmeasured, become the root cause of unexpected failures, unplanned downtime, and costly maintenance cycles. Traditional torque measurement solutions require shaft…
-
 Ash Hopper Monitoring, Boiler Monitoring, Condition Monitoring, Edge Solutions, Industrial Data Acquisition, industrial IoT, Industrial Monitoring, Power Plant Monitoring, Predictive Maintenance, Recovery Boiler, sootblower monitoring, Strain Gauge Monitoring, Thermocouple Monitoring, vibration monitoring, Wireless Monitoring
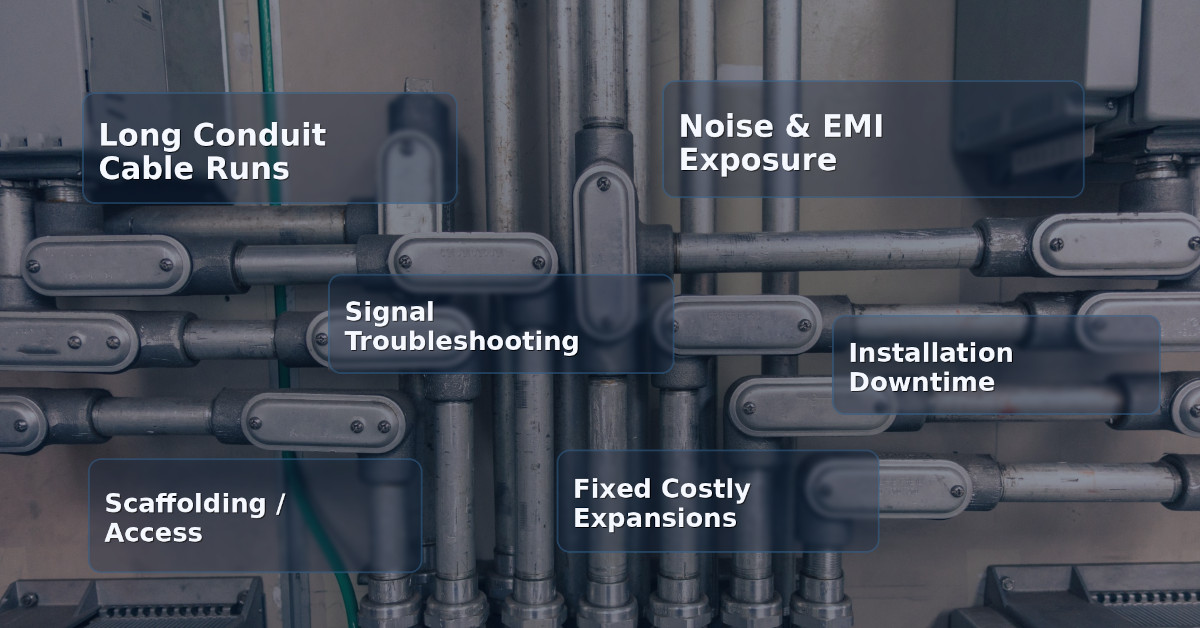
Hardwired vs. Wireless Industrial Monitoring: When Does Wireless Actually Make Sense?
For decades, hardwired data acquisition has been the default standard for industrial monitoring. From strain gauges on structural supports to thermocouples in recovery boilers, running conduit and pulling cable has been considered the “safe”…