
Edge Solutions
Rolling Mill Torque Monitoring — TT50 + ITM Connect
“Every pass starts with a torque shock — the one motor current never shows.”
Rolling Mill Torque Monitoring — TT50 + ITM Connect
- Measures spindle torque directly, on steel and aluminum mills — no shaft disassembly, custom machining or base-mount hardware.
- Captures every slab entry at high rate and reduces it to the numbers mill engineers already use: torque amplification factor, peak and reverse torque.
- Turns torque cycles into spindle life consumed, so couplings and spindles are changed on evidence instead of after a failure.
- Publishes results as tags to the mill’s Level 1 and Level 2 systems and historian, beside slab temperature, roll force and speed.
Rolling Mill Torque Monitoring App
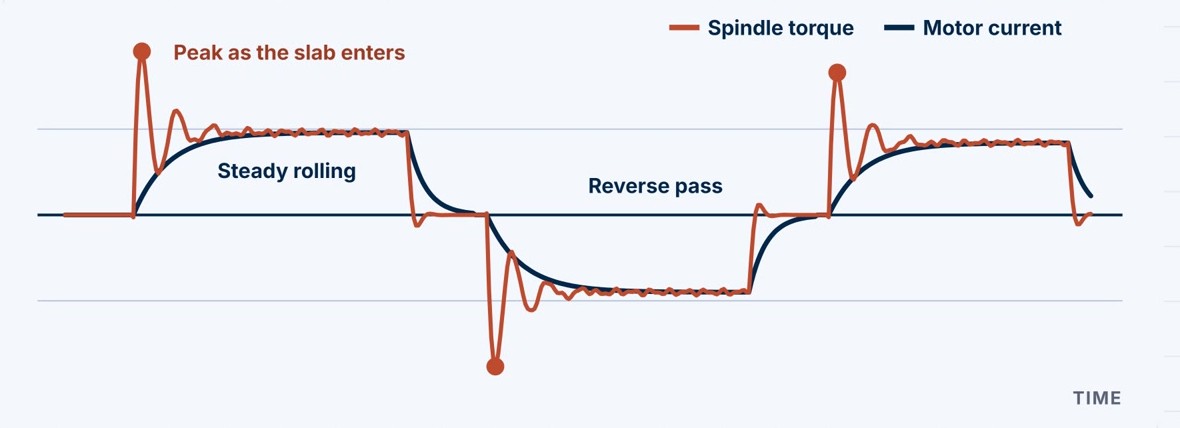
When a slab enters the roll gap, the drive train takes a shock well above steady rolling torque, then rings at its torsional natural frequency. The mill’s drives report motor current, which follows steady load but not that transient. The Binsfeld TorqueTrak 50 (TT50) clamps onto the spindle or the motor shaft and measures the strain in it. The Rolling Mill Torque Monitoring App is what turns that measurement into a mill signal. Running on ITM Connect at the edge, it holds the Bluetooth link to each collar, trends torque, speed and power continuously, captures every slab entry at high rate, and reduces each capture to a short list of KPIs that it shows live, alarms on and publishes to the mill.
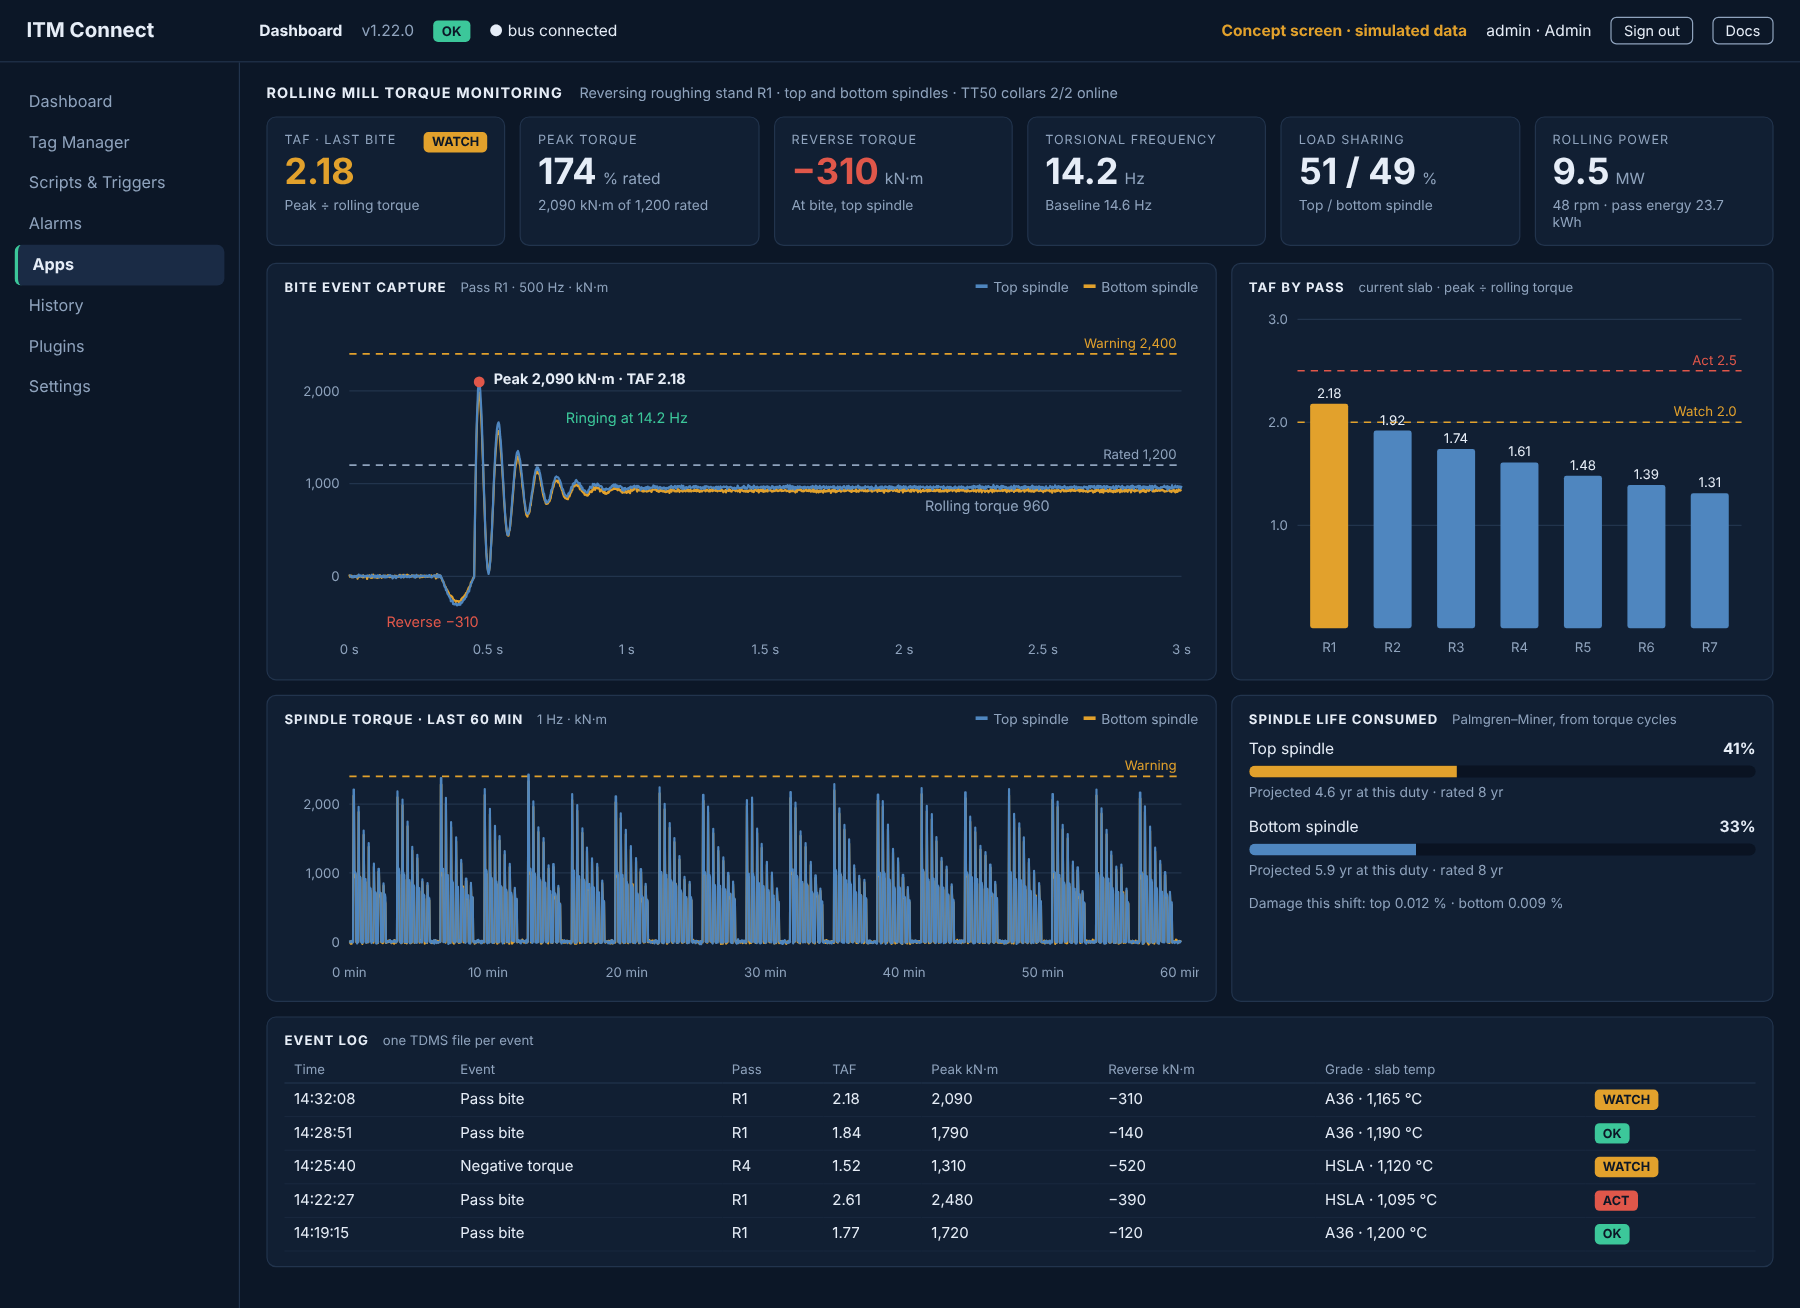
- Continuous trend — torque, shaft speed and power for each spindle, once per second, on one page in any browser on the network.
- Event capture — every pass bite, negative-torque event and overload is recorded at 500 samples per second, along with startup, periodic, manual and externally triggered captures. One TDMS file per event.
- Bite KPIs — torque amplification factor, peak torque against rating, reverse torque, pass energy and torsional frequency, calculated for every capture.
- Top and bottom spindles — a collar on each spindle shows how the stand shares its load, and which side is taking the shock.
- Life consumed — torque cycles are counted and accumulated per spindle, so remaining life is tracked from measured load.
- Publishes it to the mill — every KPI and alarm state is a Modbus TCP tag, ready for the Level 1 and Level 2 systems and the historian.
At a glance: 2 strain channels per collar · up to 2400 S/s over Bluetooth Low Energy · shafts from 65 mm to 1 m or larger · IP66, −40 to 70 °C · rated to 666 rpm · 1 Hz trend plus 500 Hz event capture · Modbus TCP.
Event capture is the differentiator. Motor current shows half the story. A one-second trend averages the torque shock away, and motor current never saw it. In one published hot mill measurement the spindle peaked at 9.82 million in-lb while motor current indicated 4.80 million, and a reverse torque of −3.76 million in-lb at slab entry went undetected. Capturing each slab entry at the edge turns that hidden event into a number per pass — trendable, alarmable and available to the mill’s own systems.
TorqueTrak and the TT50 are products of Binsfeld Engineering Inc.
References: published sources for the figures and methods on this page.
- “Torsional Issues: Stop Guessing and Measure the Problems Directly”, CBM Connect — measured spindle torque against motor current on a hot rolling mill.
- “Telemetry System to Monitor Elastic Torque on Rolling Stand Spindles”, Journal of Manufacturing and Materials Processing, MDPI, 2024 — bite amplification, spindle fatigue life and results on a 5000 mm plate mill.
- “New Monitoring Program Helps Protect Rolling Mill Drives for Safe Increases in Mill Loads”, Emerson (Kop-Flex), via Reliabilityweb — the torque amplification factor, the 2.5 rule of thumb and reductions of up to 50%.
- Jaure News, July 2021 — torque monitoring after a spindle crack on an aluminum hot rolling mill.
- “Dynamic Effects and Torque Limitation in Heavy Plate Mill Drivelines”, ABM Proceedings, 2011 — the shrinking margin between design torque and operating torque.
- TT50 SPM specifications, Binsfeld Engineering — shaft size, sample rate, speed and environmental ratings.
One pass. Three numbers.
There is no formal standard for rolling mill torque KPIs, but mill builders, coupling suppliers and the published studies use the same few measures. The app reports them for every pass — so the question is not whether the drive train is being shocked, but by how much, how often and on which products.
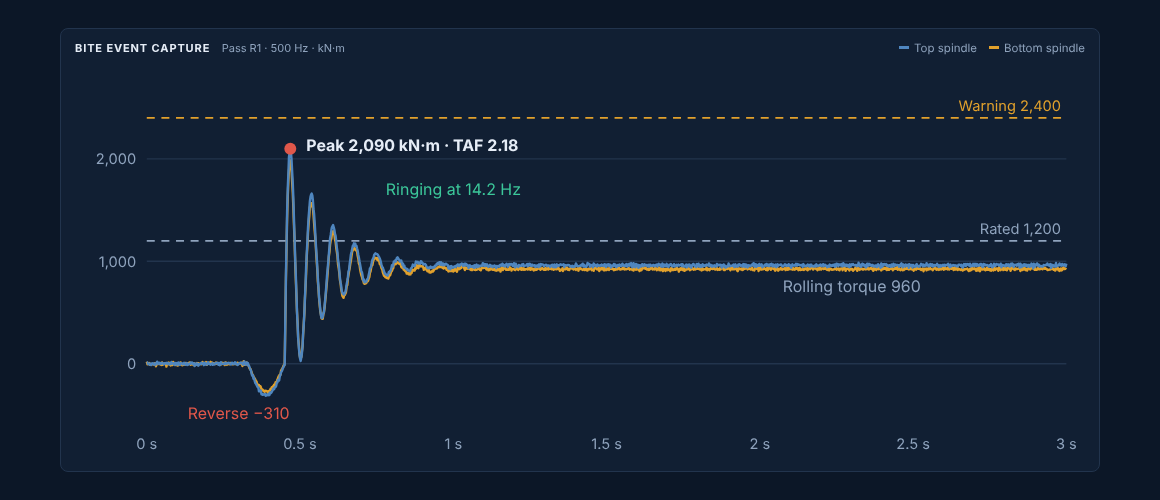
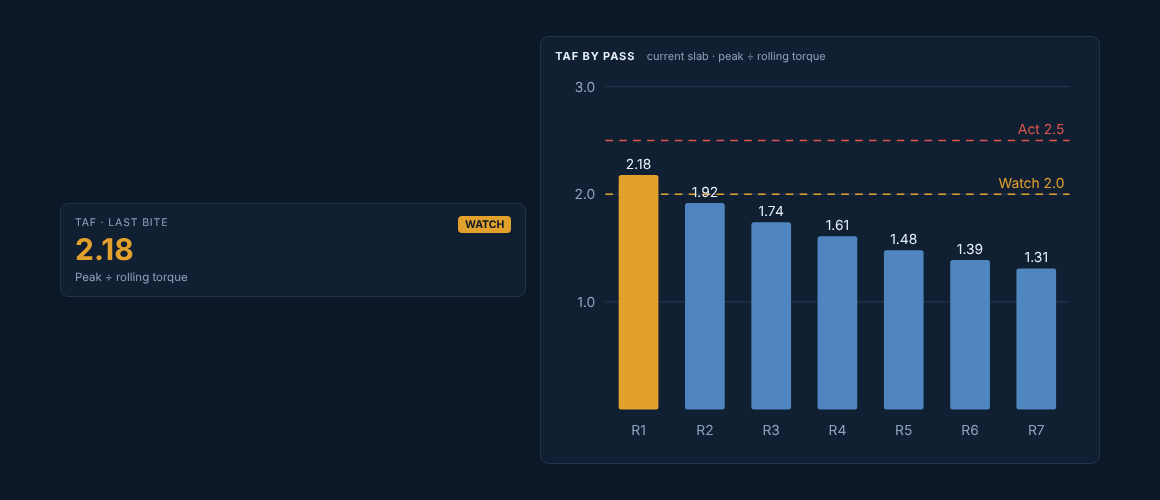
Torque amplification factor
Peak torque divided by steady rolling torque, for each pass. It is the closest thing the industry has to a standard measure of how hard a slab entry hits the drive.
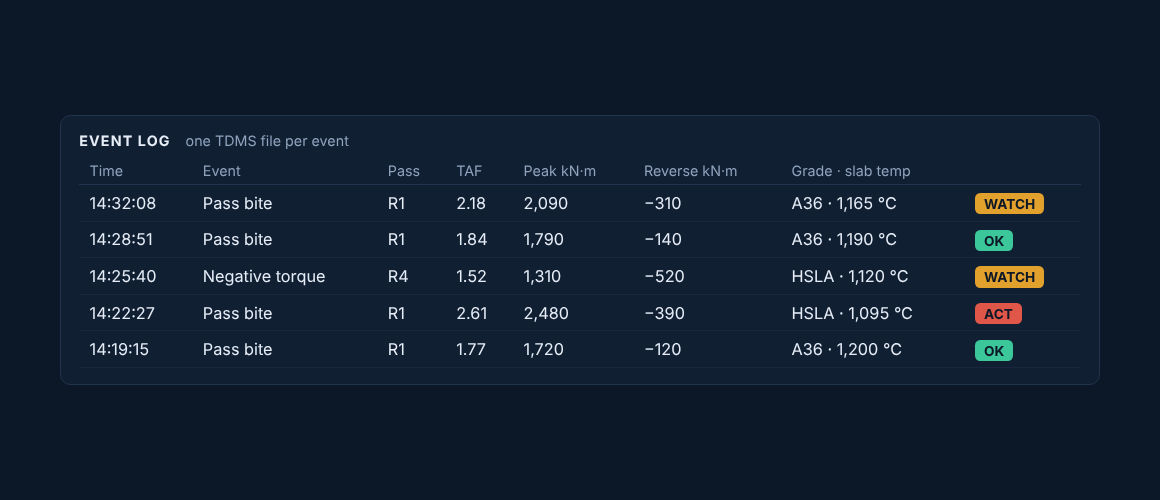
Reverse torque
The torque reversal at slab entry or tail-out. It closes the backlash in spindle joints and gears, and the impact that follows is what accumulates fatigue.
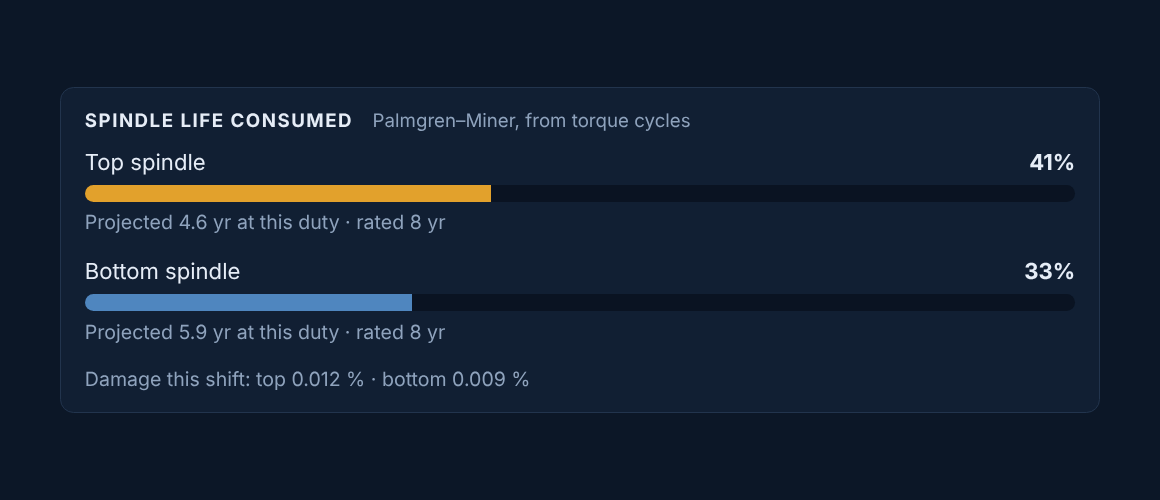
Spindle life consumed
Every torque cycle uses a little of a spindle’s fatigue life. Counting the cycles from the measured torque and adding the damage shows how fast each spindle is being used up.
Where it fits
Direct torque measurement pays back fastest where slabs are heavy and bite shocks are largest. The TT50’s ratings decide which shafts it can go on.
- Strong fit — reversing roughing stands, plate mills and the early finishing stands of steel hot mills, and aluminum hot mills, where spindle and coupling failures cost the most downtime.
- Check speed — the TT50 is rated to 666 rpm. Faster drives, including many cold and foil mills, need a slower shaft in the train or a different sensor.
- Check heat — the transmitter is rated to 70 °C. Near a hot stand it goes on the motor-side shaft, or behind a shield, away from radiant heat, scale and descaling water.
- Check range — the radio link is short on a rotating shaft, so the ITM Compute edge computer or its antenna mounts close to the drive.
What mills have gained from measuring torque
These are published results from other torque monitoring programs, not ITM installations. On a 5000 mm plate mill, spindle torque at bite reached 3 to 3.5 times steady rolling torque, and spindles rated for 8 years were lasting 3 to 4. Using the measured torque to change the bite practice cut the dynamic factor by 15 to 32%, saved 25 to 30 hours of downtime a year and added 3,800 to 4,500 tons of output (MDPI, 2024). One coupling supplier reports torque amplification reduced by up to 50% from torque-led changes to the drive, and notes that the old rule of keeping TAF under 2.5 no longer holds as mills roll tougher alloys and thicker, colder slabs (Reliabilityweb).
A typical deployment
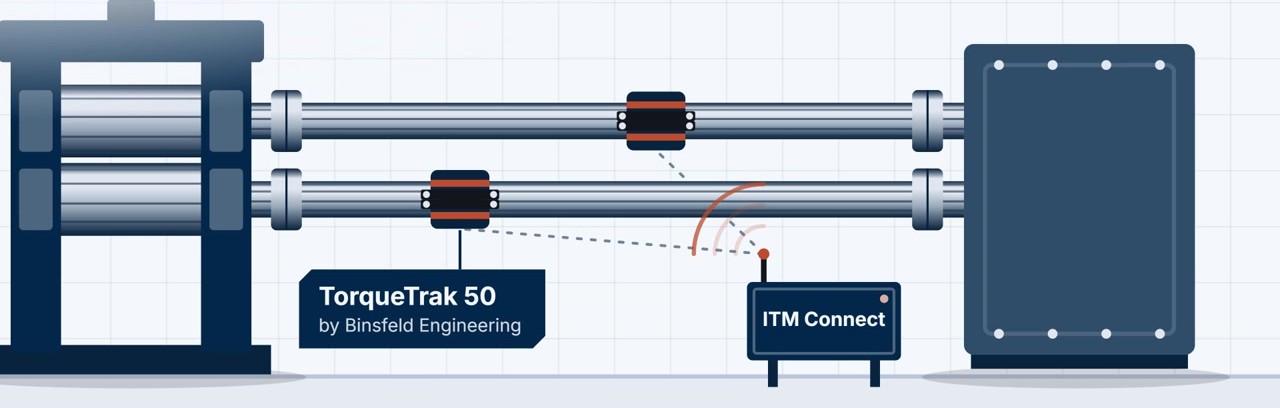
- Pick the stand. Start where spindle or coupling failures have already cost downtime — usually the reversing roughing stand.
- Choose the location. The spindle shaft between the pinion stand and the roll, or the motor-to-pinion shaft where the spindles are too hot or are handled at roll change.
- Install at an outage. Strain gauges are bonded, one collar is clamped on each spindle and the channels are shunt-calibrated.
- Mount the edge computer. An ITM Compute edge computer running ITM Connect goes in a drive-side enclosure within radio range, with Ethernet to the mill network.
- Baseline. A few weeks across the product mix builds the TAF picture by grade, width and slab temperature.
- Set limits and act. Watch and Act levels are set on the mill’s own data, then bite practice, backlash and coupling stiffness are addressed where the data points.
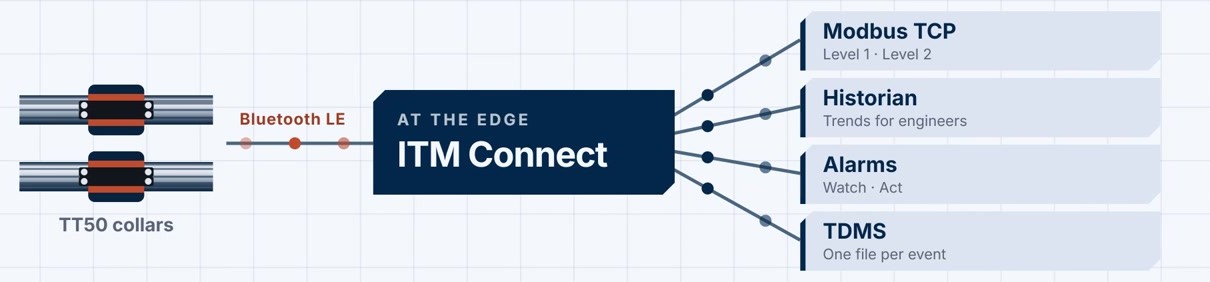
For the collar, the wireless link and the torque, thrust and bending measurements in detail, see Torque Monitoring — TT50 + ITM Connect.
“From Shaft to Cloud” program with Binsfeld Engineering.
Next step: start with one stand, then cover the mill.
Talk to an engineer: (844) 837-8797 · info@iTestSystem.com
Related Edge Solutions resources
-

Wireless Torque. Connected Fleet. Meet ITM at the International WorkBoat Show 2026
Visit ITM at the International WorkBoat Show in New Orleans, Dec. 2–4, 2026, and see how ITM Connect turns shaft torque into insight for one vessel or a fleet.
-
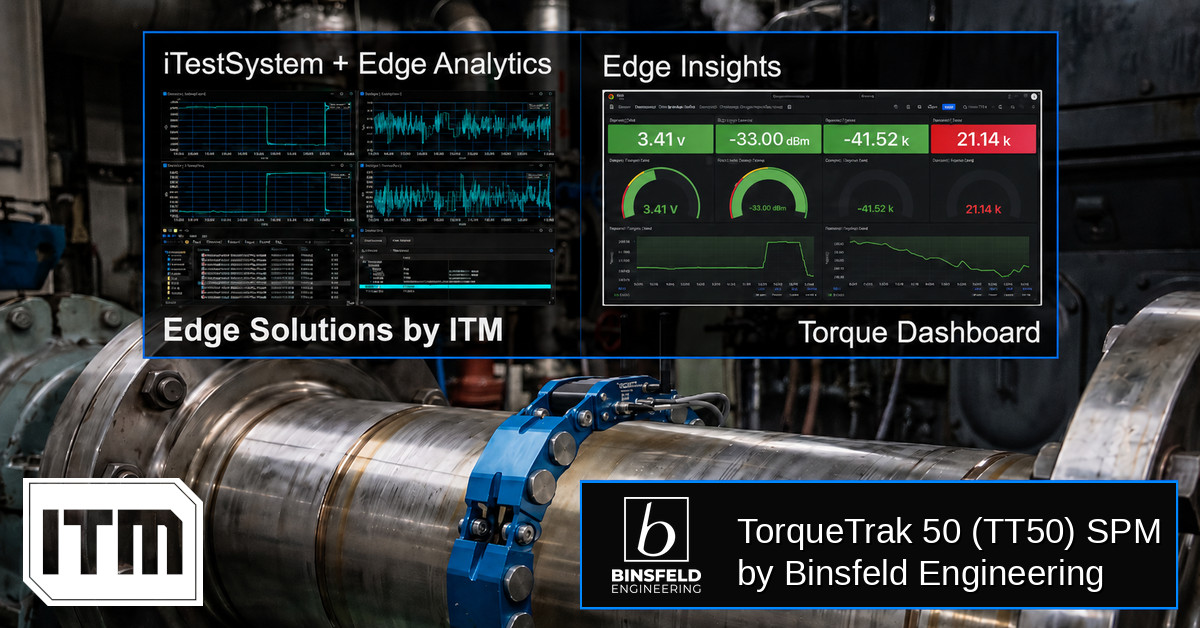
Torque-based Edge Insights: ITM iTestSystem Automated Analytics + Binsfeld TT50
In industrial and marine environments, the drivetrain is often the most critical — and least monitored — part of the system. Rotating shafts transferring torque through gearboxes, couplings, and propellers generate enormous forces that, left unmeasured, become the root cause of unexpected failures, unplanned downtime, and costly maintenance cycles. Traditional torque measurement solutions require shaft…
-
 Ash Hopper Monitoring, Boiler Monitoring, Condition Monitoring, Edge Solutions, Industrial Data Acquisition, industrial IoT, Industrial Monitoring, Power Plant Monitoring, Predictive Maintenance, Recovery Boiler, sootblower monitoring, Strain Gauge Monitoring, Thermocouple Monitoring, vibration monitoring, Wireless Monitoring
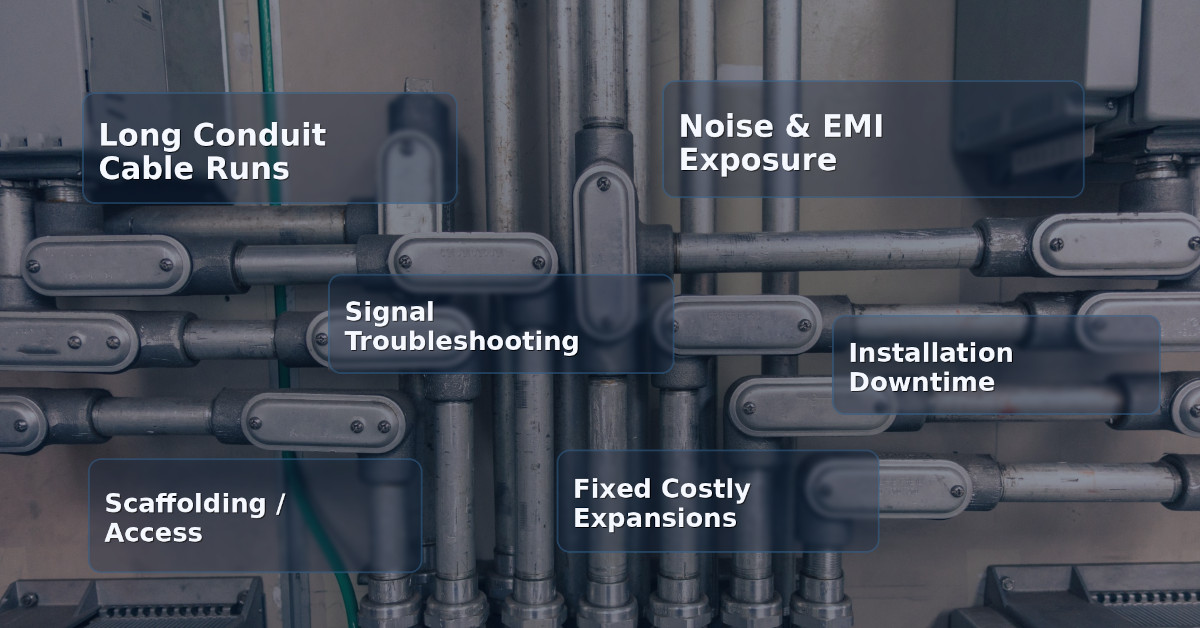
Hardwired vs. Wireless Industrial Monitoring: When Does Wireless Actually Make Sense?
For decades, hardwired data acquisition has been the default standard for industrial monitoring. From strain gauges on structural supports to thermocouples in recovery boilers, running conduit and pulling cable has been considered the “safe”…