Machine Failures Caused by Intermittent Damaging Events
Over the years we have been tasked with identifying the root cause of machine structural failures. In many cases, we can determine the failure mode through strain and vibration testing, order analysis, modal analysis, and operating deflection shape analysis. What tests can you run when the damaging conditions are intermittent and not easily identified?
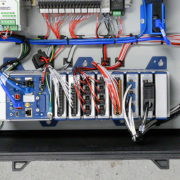
In these cases, we like to install a cellular networked temporary data acquisition (DAQ) system that can autonomously log vibration and strain data along with machine status data. We have deployed two types of DAQ systems to collect data remotely. An interactive system that includes an industrial PC running our iTestSystem software and National Instruments (NI) Compact DAQ hardware and a headless system that utilizes NI Compact RIO hardware. Our test engineers prefer using the interactive solution for troubleshooting because they can view real-time signal waveforms and collected data files, and then adjust the test parameters accordingly without having to reprogram the hardware.
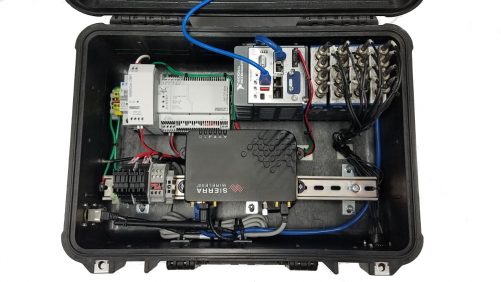
Figure 1: Headless networked data acquisition system
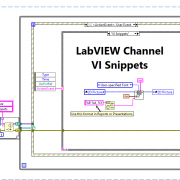
When potentially damaging events are identified in the vibration and strain data collected by these systems, it is important to know the machine’s operating status. Collecting the machine status information is just as important as collecting the structural data. Many machines transmit these operating variables and operating stages over their network/bus. Recently we have recorded process data from Allen Bradley Control Logix PLCs via Ethernet/IP, mining machine data from a Siemens controller via proprietary TCP/IP protocol, boiler condition data from a DCS via Modbus TCP, machine pressures from PI historian via the UFL connector (TCP), and vehicle speeds and pressure via CAN. Fortunately, we were able to use and adapt LabVIEW communication protocol tools to build applications and addons that allow this network tag data to be collected along with structural data.
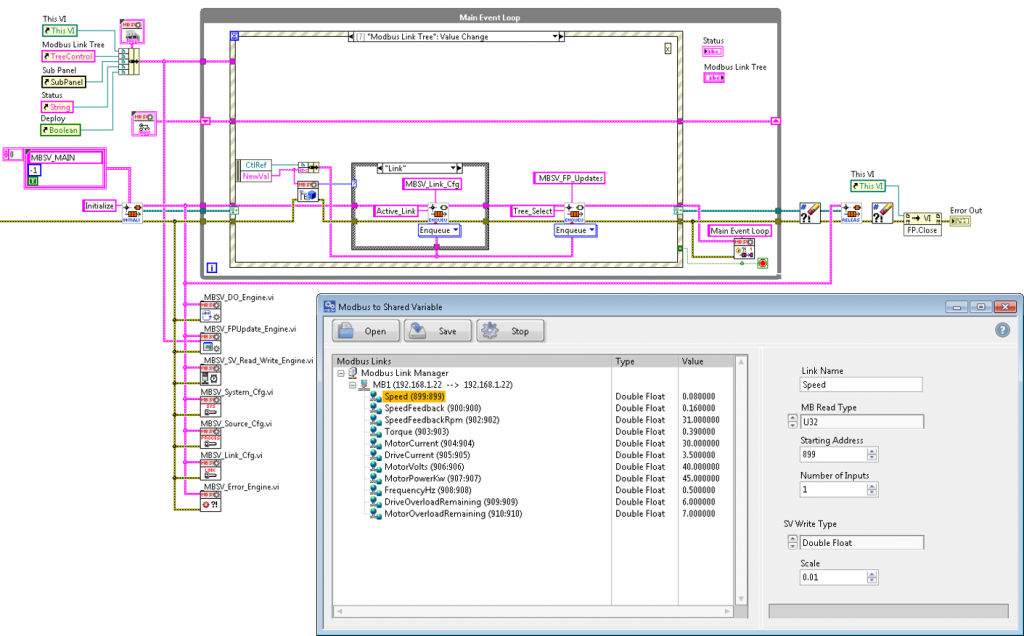
Figure 2: Modbus to Shared Variable Tool
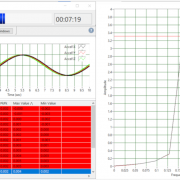
After the data collection phase, our engineers perform statistical analysis on the sensor and status channels in all data files and aggregate the results into a database for searchability. To identify the root cause probabilities, you can process the channel statistics data using your favorite correlation algorithm or application. The image below shows an example data set containing related sensor data that was processed using a LabVIEW correlation test tool.
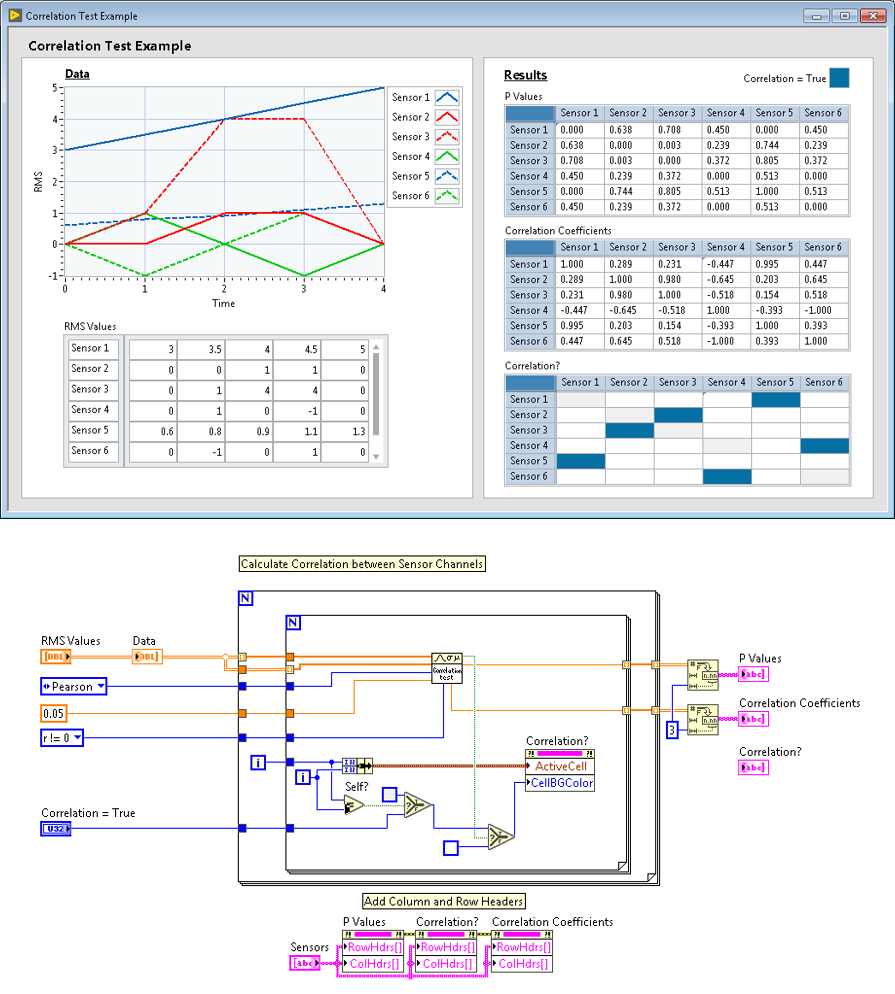
Figure 3: Correlation Test Example vi
Contact Information: For more information about our remote data acquisition service, our LabVIEW development service, or iTestSystem contact:
Mark Yeager – Integrated Test & Measurement (ITM), LLC. Email: mark.yeager@itestsystem.com or Phone: 1.844.TestSys
Recent News: Ohio University Asphalt Cracking Prediction System Project

