Accelerometers for Rotating Machinery Vibration Measurements
Choosing an accelerometer for rotating machinery vibration measurements can be a daunting task since there are so many options available. This blog outlines the characteristics you should consider when choosing a piezoelectric single axis accelerometer for general purpose vibration measurements and presents some accelerometers to consider.
Characteristics of a General Purpose Accelerometer
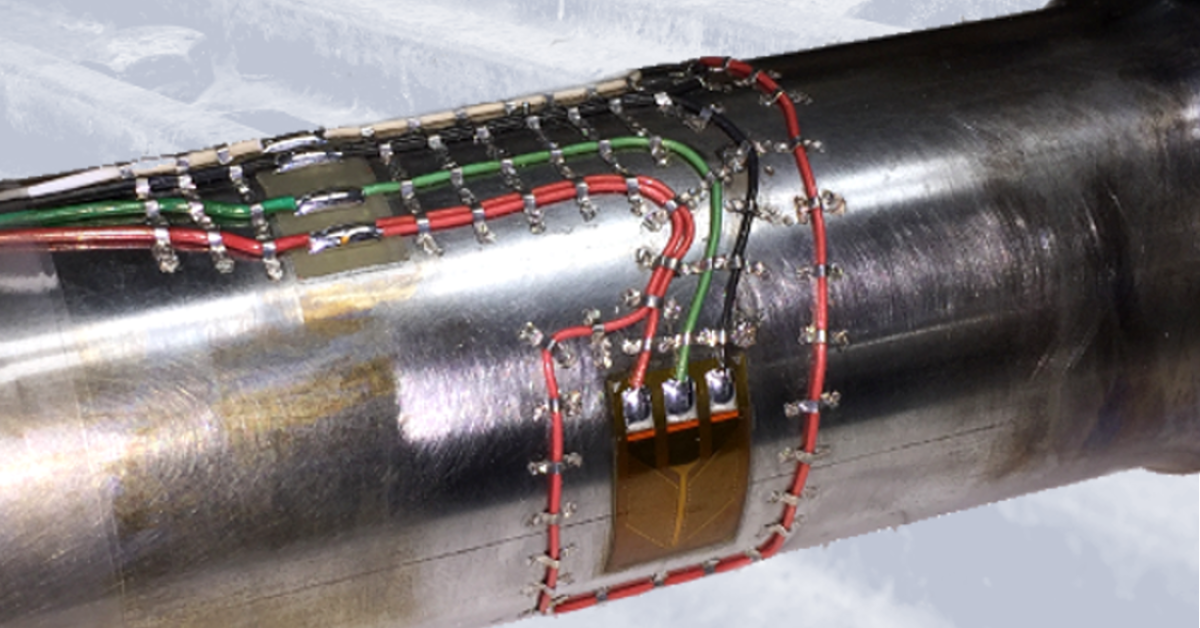
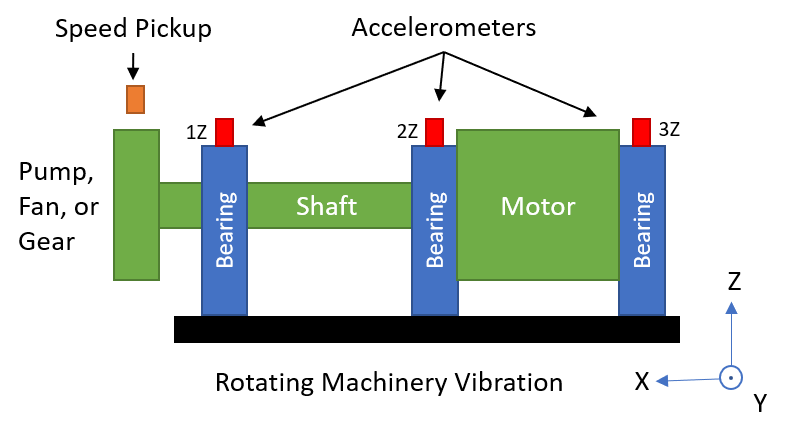
When measuring vibration on rotating equipment such as motors, pumps, and generators, the most common measurement location(s) are on the shaft bearing housing(s) at the shaft centerline. At this location, typical vibration levels perpendicular to the shaft are < 100 g and the frequency range of interest is < 5000 Hz. A general purpose single axis piezoelectric accelerometer with either a 10 mV/g or 100 mV/g sensitivity fits this criteria.
Other characteristics to consider are size, mounting options, cable connections, grounding, and cost. Several mounting options are available. They include magnetic bases, adhesive bases and stud mounts. The mounting option you choose affects the frequency range of your accelerometer measurements. The table below shows typical frequency limits for accelerometer mounting methods.
| Mount Type | Typical Frequency Limit |
| Magnet | 2,000 Hz |
| Adhesive | 5,000 Hz |
| Stud | 6,000 Hz |
5 General Purpose Accelerometers
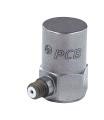
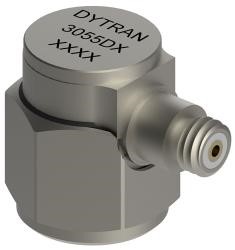
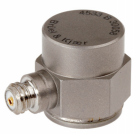
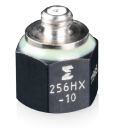
The table below shows some examples of stud mounted general purpose piezoelectric accelerometers. These accelerometers all have a female 10-32 coaxial / microdot connector. It is important to note that this is not a complete list of accelerometers and there are many options available from each manufacturer. I would encourage you to go to the websites linked in the table and see what’s available.
 |
 |
 |
 |
 |
|
| Manufacturer | PCB | Dytran | BRÜEL & KJÆR | Endevco | Kistler |
| Model # | 353B03 | 3055D1 | 4533-B | 256HX -10 | 8702B500-M1 |
| Sensitivity | 10 mV/g | 10 mV/g | 9.8 mV/g | 10 mV/g | 10 mV/g |
| Frequency Range | (±5%) 1 to 7000 Hz | (±5%) 1 to 5000 Hz | (±10%) 0.2 – 12800 Hz | (±10%) 1 to 10000 Hz | (±5%) 1-10000 Hz |
| Temperature Range | -65 to +250 °F | -67 to +250 °F | –67 to +257 °F | -67˚F to +257˚F | -67˚F to +257˚F |
| Height | 0.88 in | 0.64 in | 0.54 in | 0.55 in | 0.67 in |
| Weight | 0.38 oz | 0.35 oz | 0.3 oz | 0.14 oz | 0.32 oz |
| Housing Material | Titanium | Titanium | Titanium | Titanium | Titanium |
| Electrical Connector | 10-32 Coaxial (side) | 10-32 Coaxial (side) | 10–32 Coaxial (side) | 10–32 Coaxial (top) | 10–32 Coaxial (side) |
| Mounting Thread | 10-32 Female | 10-32 Female | 10-32 Female | 10-32 Female | 10-32 Female |
For more information about collecting vibration data, accelerometers, iTestSystem, or test equipment rental, contact Mark Yeager @ (844) 837-8797 x701.