
Tag Archive for: TestView Plus
Identify Damaging Events with Statistical Analysis
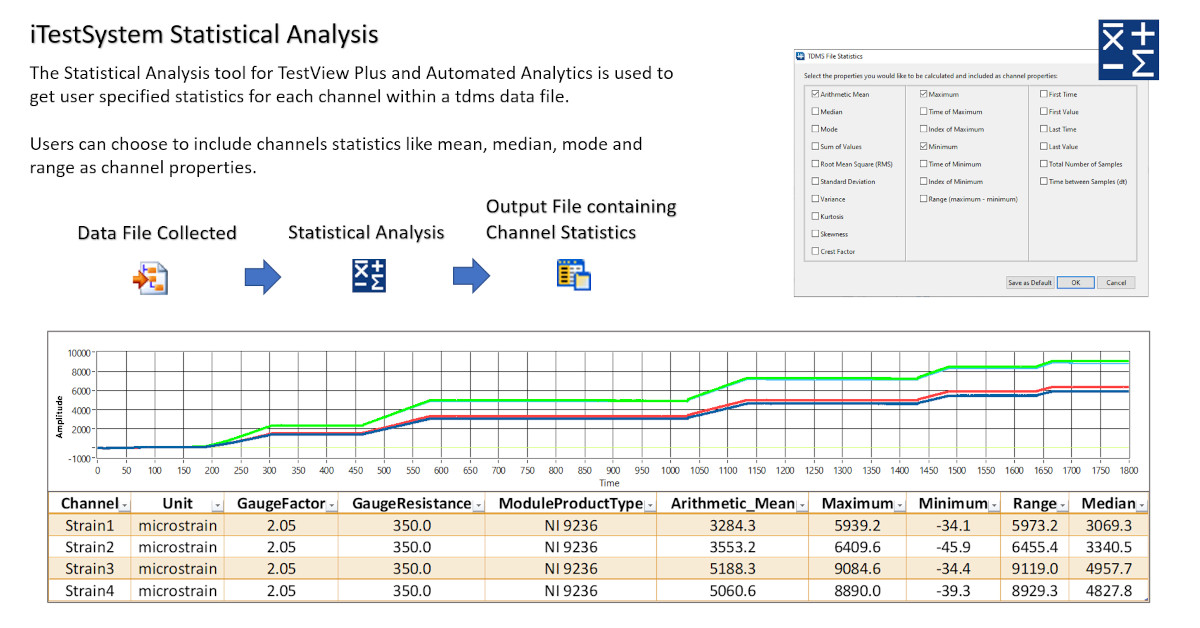
Quickly Identify Significant Events in Large Data Sets with Statistical Analysis
Use statistical analysis for TestView Plus and Automated Analytics to extract statistics like minimum, maximum, and mean from each sensor. The results of the selectable analysis is embedded within the data file as searchable meta data.
Automated Analytics users can quickly identify data files within large data sets that contain sensor events of interest. When paired with Trigger Analysis and the Notification Service, these data files can be automatically selected and sent via email in remote monitoring applications.
About iTestSystem
iTestSystem is an engineering measurement software platform that enables test engineers to organize, acquire, view, and analyze data from machinery, processes, vehicles and other complex systems. iTestSystem was specifically designed for use with NI cDAQ or FieldDAQ hardware for data collection and data logging.
For more information about our iTestSystem or ITM’s testing services, contact Ryan Welker @ (844) 837-8797 x702.
Vibration Data Integration Analysis
Simplify Acceleration Conversions with iTestSystem’s Integration Analysis Tool
Like many features in iTestSystem, the Integration Analysis tool was created because customers requested it. After all, who doesn’t like features that make the math easier?
In this blog, a new series by ITM, we’ll share some details about Integration Analysis, one of the features within TestView Plus, the project based data viewing function within iTestSystem.
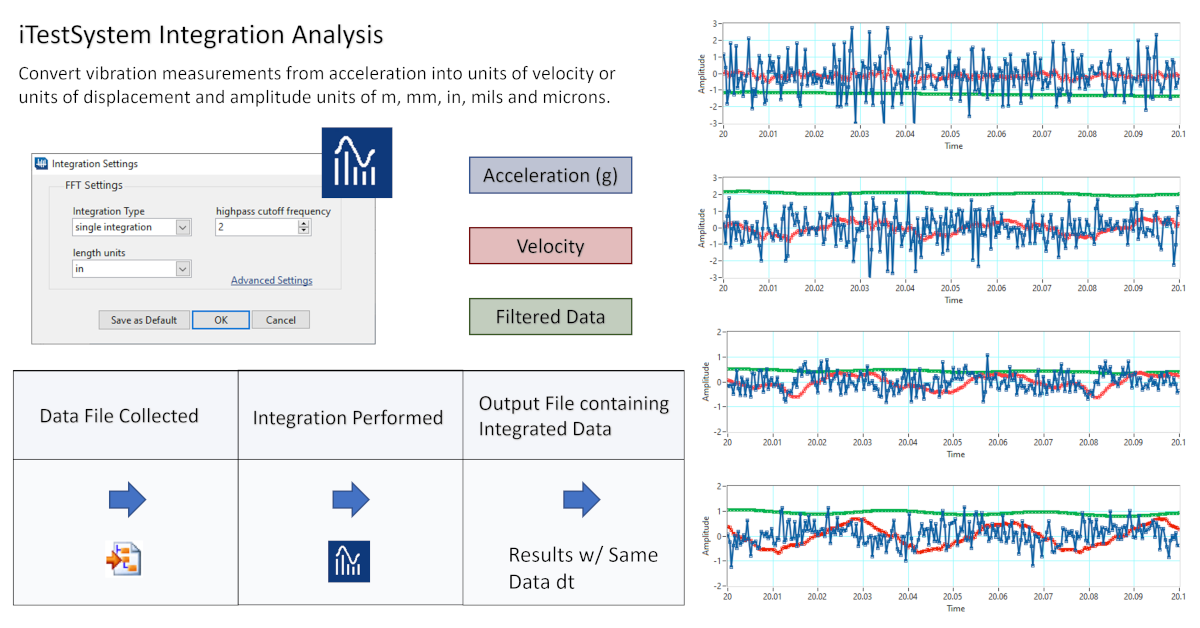
For engineers who are gathering vibration data, it makes perfect sense to have a simple way to convert acceleration into units of velocity or units of displacement since those are the most common specs.
Enter the Integration Analysis function. Simply open TestView Plus, drop down the “Analysis” tab and select “Integration.” Once there, adjust the settings to either “Single Integration” for velocity or “Double Integration” for displacement. In a couple of additional clicks, you can also specify your desired units and adjust the high cutoff frequency to filter low frequency data.
The next time you are gathering data using accelerometers, let iTestSystem simplify all those conversions with Integration Analysis.
About iTestSystem
iTestSystem is an engineering measurement software platform that enables test engineers to organize, acquire, view, and analyze data from machinery, processes, vehicles and other complex systems. iTestSystem was specifically designed for use with National Instruments (NI) cDAQ or FieldDAQ hardware for data collection and data logging.
For more information about our iTestSystem or ITM’s testing services, contact Ryan Welker @ (844) 837-8797 x702.
Weed Out Unwanted Data with Filter Analysis
For engineers, the faster one can weed out the noise, the more efficiently one can deliver actual solutions.
The software architects at Integrated Test & Measurement have added new plugin technology to iTestSystem, their proprietary engineering measurement software platform, to enhance the user experience by allowing users to analyze data faster by filtering frequencies simply.
In this blog, a new series by ITM, we’ll share some details about one of the features within TestView Plus, the project based data viewing function within iTestSystem.
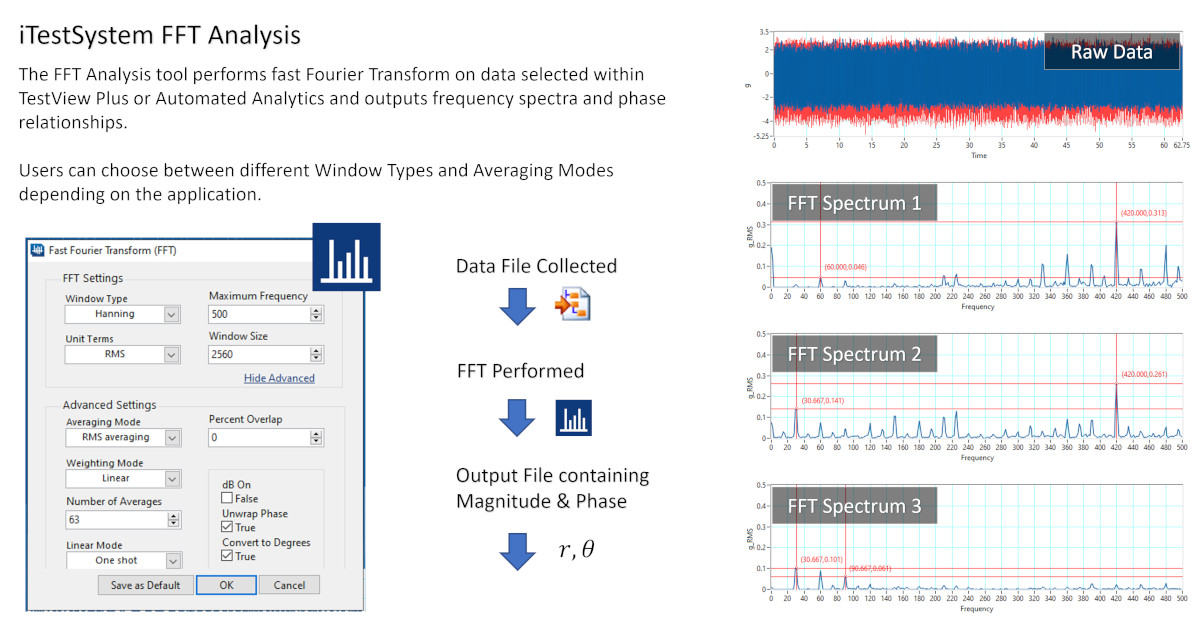
Once you’ve configured your test using NI MultiDAQ hardware and begun logging strain gauge and accelerometer data, it is time to do an FFT (fast Fourier transform) Analysis to further analyze your signals for frequency information to learn how the system you are testing is actually vibrating.
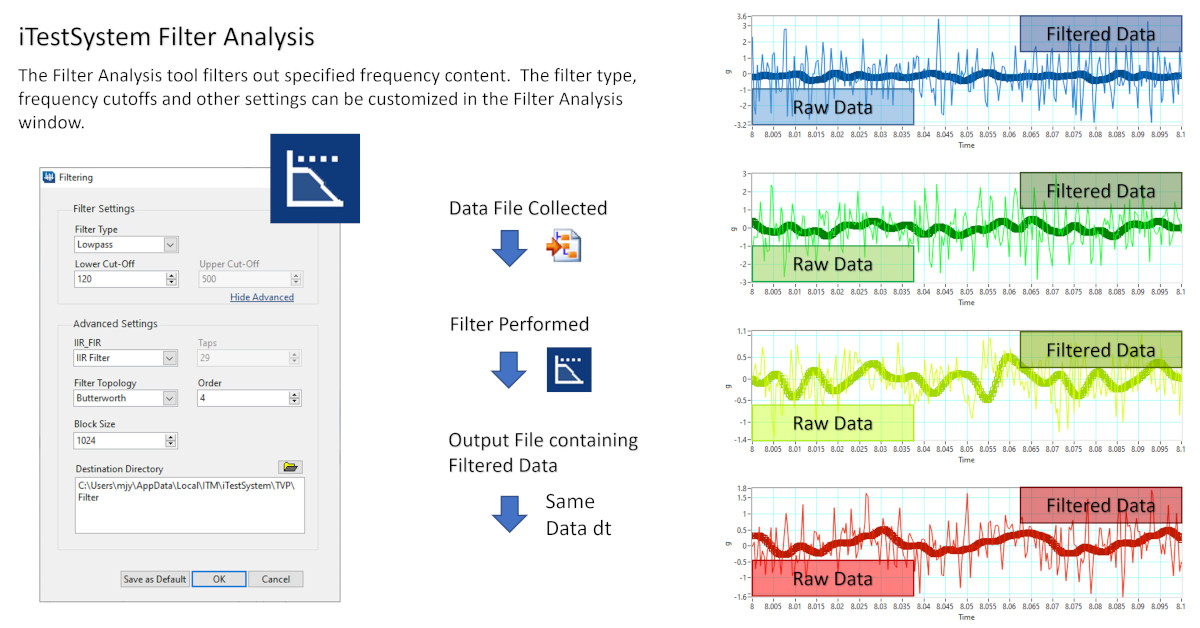
As part of that process, the Filter Analysis plugin allows users to filter out unwanted frequencies — say anything over 100 Hz — which only requires checking a simple low-pass filter option, a tool embedded right within TestView Plus.
Without leaving TestView Plus, you can simply choose which signals you wish to view, configure a few options on the screen and click the FFT button to output helpful data files for your report or plot directly within TestView Plus to begin isolating specific vibration issues.
Stay tuned for additional iTestSystem features.
About iTestSystem
iTestSystem is an engineering measurement software platform that enables test engineers to organize, acquire, view, and analyze data from machinery, processes, vehicles and other complex systems. iTestSystem was specifically designed for use with National Instruments (NI) cDAQ hardware for data collection and data logging.
For more information about our iTestSystem or ITM’s testing services, contact Ryan Welker @ (844) 837-8797 x702.
Reduce File Size with Resample Analysis
Going Small Can Yield Big Results Thanks to Resample Analysis Feature
While it may seem counterintuitive to those used to gathering massive data files to solve complex engineering challenges, certain situations actually require gathering smaller files if you want to run a successful test.
For example, certain tests require gathering data on remote machinery over multiple months. In that instance, the onboard hard drive that’s storing the data will simply run out of space if you are gathering data at a high sample rate.
The team at Integrated Test and Measurement anticipated such needs. In this blog, a new series by ITM, we’ll share some details about Resample Analysis, one of the features within TestView Plus, the project based data viewing function within iTestSystem.
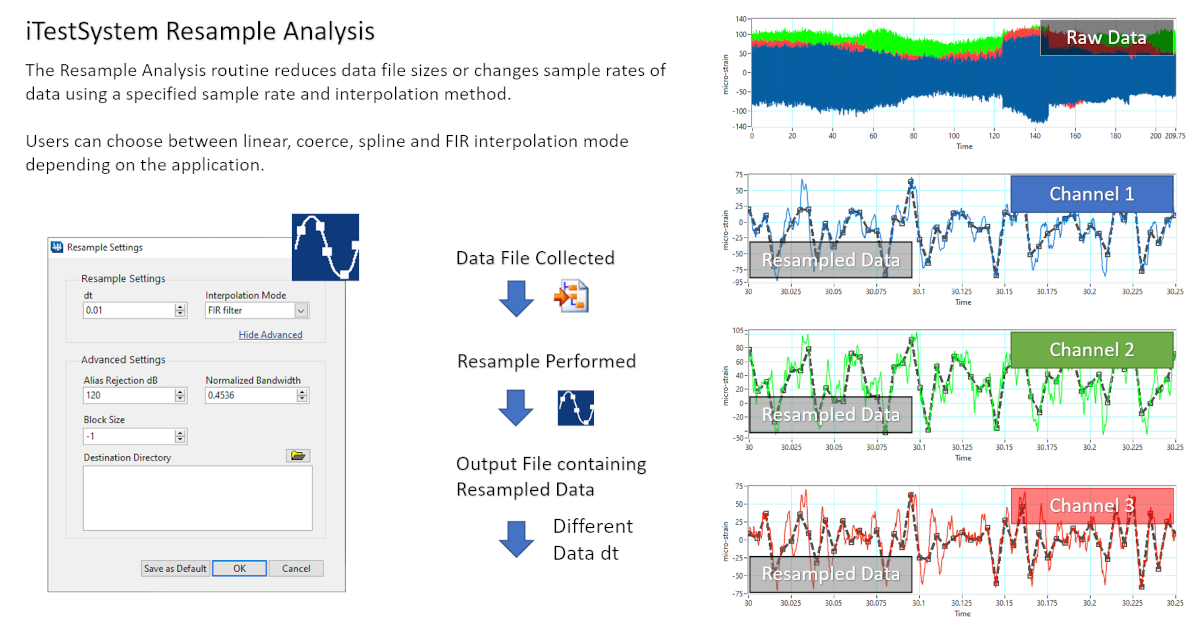
Though simple, the Resample Analysis function allows you to perform a powerful function — to greatly reduce file sizes while maintaining an accurate picture of the information gathered. With one click, raw files that were saving at 20 MB and larger are reduced to less than 1 MB, yet your engineers will still be able to capture an accurate picture of the test.
The process is easy. Open TestView Plus, add a channel, plot some data and click the Resample feature, just remember to also use the Filtering feature to avoid aliasing your data. Though you are sacrificing frequency content, you are gaining data storage, and the data will still tell you the big picture of what’s happening.
About iTestSystem
iTestSystem is an engineering measurement software platform that enables test engineers to organize, acquire, view, and analyze data from machinery, processes, vehicles and other complex systems. iTestSystem was specifically designed for use with National Instruments (NI) cDAQ or FieldDAQ hardware for data collection and data logging.
For more information about our iTestSystem or ITM’s testing services, contact Ryan Welker @ (844) 837-8797 x702.
Use FFT Analysis in iTestSystem to Pinpoint Vibration Issues
Simplifying Process for FFT Analysis using iTestSystem to Pinpoint Vibration Issues
The software engineers at Integrate Test & Measurement are constantly looking for ways to enhance and simplify your experience using iTestSystem, their proprietary engineering measurement software platform.
In this blog, a new series by ITM, we’ll share some details about one of the features within TestView Plus, the project based data viewing function within iTestSystem.
Are you one who tires of gathering vibration data in one tool then having to port it over to a whole separate tool to analyze the signal data? Thanks to plugin functionality in the latest version of iTestSystem, you can now manage both functions all from the same screen.
Once you’ve configured your test using NI MultiDAQ hardware and begun logging strain gauge and accelerometer data, it is time to do FFT (fast Fourier transform) Analysis to further analyze your signals for frequency information to learn how the system you are testing is actually vibrating. Without leaving TestView Plus, you can simply choose which signals you wish to view, configure a few options on the screen and click the convenient FFT button to output helpful data files for your report or plot directly within TestView Plus to begin isolating specific vibration issues.
Stay tuned for additional iTestSystem features, including a plugin that allows Filter Analysis to quickly weed out unwanted frequencies.
About iTestSystem
iTestSystem is an engineering measurement software platform that enables test engineers to organize, acquire, view, and analyze data from machinery, processes, vehicles and other complex systems. iTestSystem was specifically designed for use with National Instruments (NI) cDAQ or FieldDAQ hardware for data collection and data logging.
For more information about our iTestSystem or ITM’s testing services, contact Ryan Welker @ (844) 837-8797 x702.
Sort Data Faster Using iTestSystem’s Trigger Analysis
Sort Your Engineering Data Faster Using iTestSystem’s Trigger Analysis Feature
Tired of getting buried in a mountain of engineering data? The team at Integrated Test & Measurement feels your pain, and they have built some relief into their data collection software known as iTestSystem.
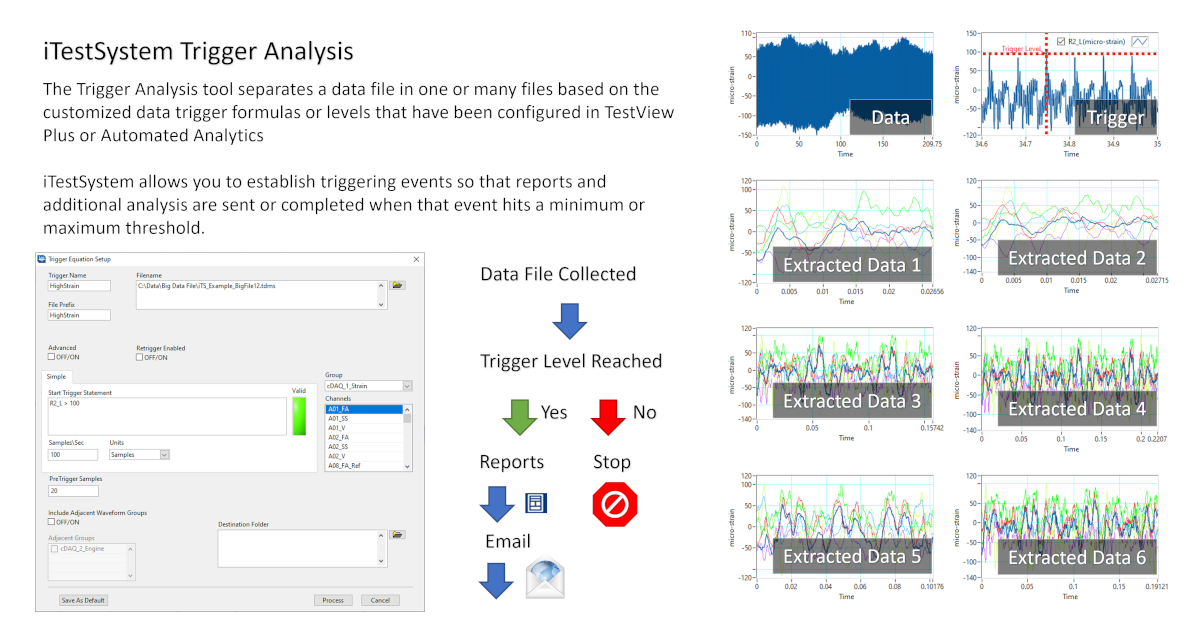
In this blog, a new series by ITM, we’ll share details about iTestSystem’s “Trigger Analysis” feature, which is commonly used to help analyze, sort and pass crucial engineering data — think strain and vibration — to those who need it most and just in time.
The Trigger Analysis tool separates a data file in one or many files based on the customized data trigger(s) that have been configured, and that’s a feature that saves engineers countless hours.
Here’s how Trigger Analysis works:
If you are an engineer attempting to gather data from a piece of machinery, vehicle or complex system, iTestSystem allows you to establish triggering events so that reports are only sent when that event hits a minimum or maximum threshold. For example, if you know a damaging event occurs at a certain threshold, you can easily set iTestSystem to only report information or graphs to you when an accelerometer goes over a maximum level or when an engine passes a set RPM.
In other words, the software is gathering data constantly, but it only sends the data when it matches a specific threshold.
By configuring Trigger Analysis along with both Notification Services and the Automated Analytics features in iTestSystem, engineers are able to greatly simplify processes that require hunting down system operation outliers or damaging events. These iTestSystem applications allow users to analyze, build, and send sensor level reports only when specific vibration and strain limits are exceeded. In the end, that leads to a massive time savings. Instead of searching through streams of data files, engineers can easily review the report and download relevant data files from deployed systems for further analysis.
About iTestSystem
iTestSystem is an engineering measurement software platform that enables test engineers to organize, acquire, view, and analyze data from machinery, processes, vehicles and other complex systems. iTestSystem was specifically designed for use with National Instruments (NI) cDAQ hardware for data collection and data logging.
For more information about our iTestSystem or ITM’s testing services, contact Ryan Welker @ (844) 837-8797 x702.
iTestSystem Application: TestView Plus

TestView Plus is an iTestSystem application for quick and easy viewing and analysis of data recorded in .TDMS files. Test engineers can open data files and then simply drag and drop data channels into a variety of graphs and tables. Data plotting algorithms allow for viewing and zooming into even the largest data files without running into memory issues.
TestView Plus has many features that allow test engineers to manage multiple data analysis projects at once. TestView Plus Sessions allow for fast transitions between data processing projects. A Session retains the current tab and graph information, analysis files, and data workspace. TestView Plus Windows and Tabs allow for quickly adding and ordering new and existing data views. The TestView Plus Reporting Utility allows for simple customized layouts sized to fit neatly in a report or presentation.
Besides data viewing, TestView Plus also provides access to the iTestSystem analysis functions. Data analysis can be performed on data in an active Time History graph. To run an Analysis tool, select an icon in the Analysis toolbar or select an option in the “Analysis” dropdown in menu toolbar. Once the analysis is performed, the results will be graphed in a new window.
iTestSystem Tip: Strain Gauge Rosette Analysis
When troubleshooting structural failures or validating FEA models through testing, strain gauge rosettes are used to find the full state of strain at areas of concern around the structure. iTestSystem’s Rosette Analysis tool is used to calculate the principal strain, principal strain angle, shear strain, principal stress, and other values from strain gauge rosette data. This video shows how to use the Rosette analysis tool.
For questions about using the Rosette Analysis tool or other iTestSystem analysis tools contact Chase Petzinger.
Download your free version of iTestSystem today.
iTestSystem: New Release v16.1
We are excited to announce that a new version (16.1) of iTestSystem is available for download. This latest release provides engineers with a flexible sensor data collection and analysis platform ideal for long term endurance testing, vibration analysis, off -highway vehicle condition monitoring, sound level, and structural design validation.
We have added and updated the following tools:
- New Microphone Sensor Type and Dataview for Sound Level Measurements
- Expanded Data Acquisition Hardware Support including the rugged NI FieldDAQ Device
- New Automated Data Analysis Tools including sensor statistics, scaling, and sound level
- Updated File Filtering and Improve Data Interaction
- Updated Impact Test DAQ with 3D Animator Integration
Download the new version today!
For more information about the new version of iTestSystem or to request a demo contact Chase.Petzinger@iTestSystem.com.
Tag Archive for: TestView Plus
ITM provides software development, structural and mechanical testing services, industrial monitoring, strain gauging, and data analysis solutions to clients on six continents. ITM is a recognized National Instruments Gold Alliance Partner.
![]()