Lattice Boom Crane Structural Design Validation
A case study describing a strain gauge DAQ system used to validate several new designs of a heavy lift lattice boom crane to comply with SAE J987 standards.
The Blog Post category contains blog posts associated with ITM’s testing services, LabVIEW programming, Test & Measurement Hardware, Boiler Monitoring Systems, and iTestSystem applications.
A case study describing a strain gauge DAQ system used to validate several new designs of a heavy lift lattice boom crane to comply with SAE J987 standards.
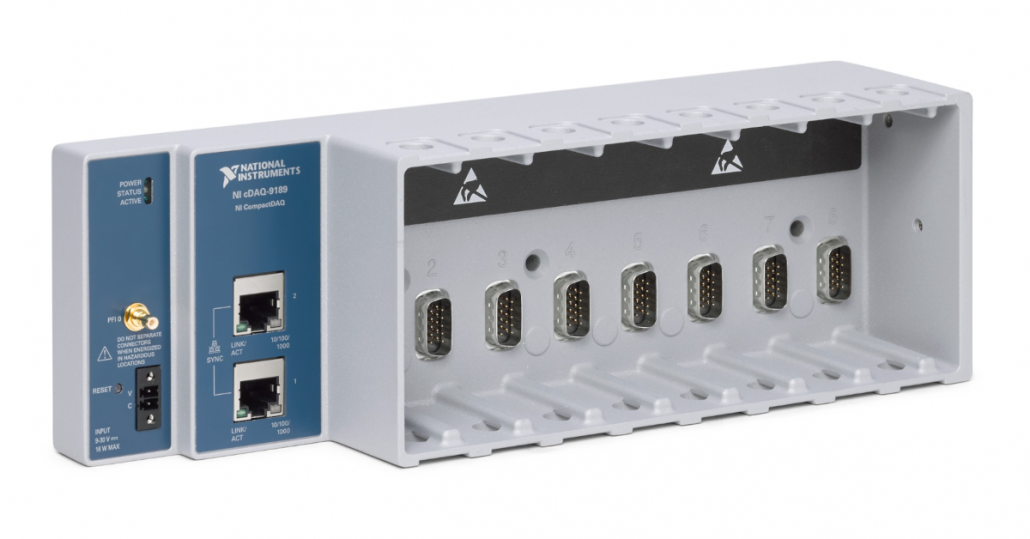
When our engineers go on the road to troubleshoot structural component failures or machine vibration problems, they grab their laptop with iTestSystem installed and Pelican case containing an NI CompactDAQ (cDAQ) chassis and an assortment of C-Series modules, accelerometers, and strain gauges. The cDAQ chassis that they typically use is a cDAQ-9189 ethernet chassis, which is ideal for data logging.
The cDAQ-9189 is an extended temperature TSN enabled 8-Slot Ethernet chassis designed for distributed sensor measurement systems. The chassis controls the timing, synchronization, and data transfer between C Series I/O modules and your laptop. Since the chassis has an integrated network switch and is TSN enabled, measurements from multiple chassis are synchronized by simply daisy-chaining chassis with an ethernet cable.
For more information about the cDAQ-9189, DAQ hardware rentals or iTestSystem, contact Josh Fishback at (844) 837-8797 x705 to assist with your data collection needs.
A case study describing a reliable system for testing generator vibration levels after production in order to verify proper unit design and assembly.
At ITM, we understand that our customers do not settle for good enough. When it comes to measuring and capturing data for real-world applications and structural analysis, you cannot compromise, so neither can we. Instead of having to pick and choose the most critical locations to measure, we ensure that you can capture every piece of data you need, simultaneously. Whether that is a single strain bridge, or thousands of strain channels, we make your data logging project a success.
On past projects, we have worked with our customers in the manufacturing industry to test the structures of their aerospace, mining, construction and other transportation equipment. Some of these applications not only needed to collect strain, vibration, voltage, and other signals simultaneously but also required well over a thousand total sensor channels. Network synchronization technology embedded within the NI cDAQ chassis allow users to account for the sheer number of channels during these structural tests. The true secret to our success in these high-channel jobs has been our iTestSystem software which leverages the cDAQ’s synchronization technology while providing an intuitive data acquisition and sensor configuration and setup.
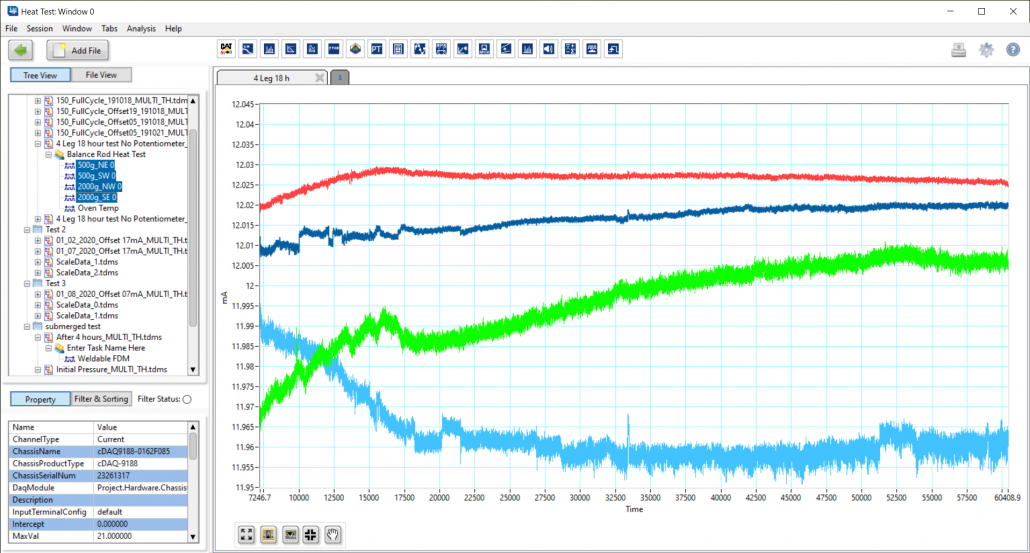
iTestSystem is far more than just a barebones data collection software. It can be a time saver to our engineers by helping to sort channels, keep various tasks organized, and even provide an easy and quick way to view results with the integrated TestView Plus Application (shown below).
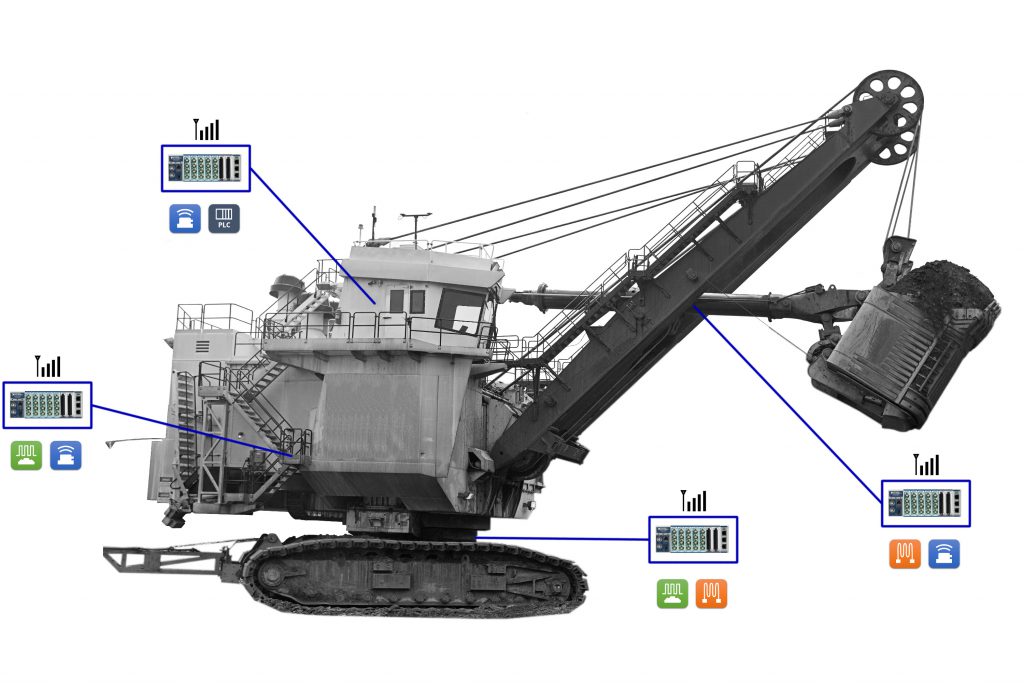
The mining shovel pictured below, which is similar to other equipment that ITM has instrumented in the past, illustrates a distributed data acquisition system for collecting data. Using iTestSystem, we can implement a modified tree synchronization topology to collect data from over 20+ cDAQ chassis simultaneously. Data can be collected in one giant file containing all sensor channels or saved into separate files based on location. In past projects, we saved over 1000 channels from strain, acceleration, and voltage sensors into a new file every 10 minutes. We added the sensor location to the sensor description, including the Boom, Operator Cab, Main Frame and Base. This allowed us to easily sort data both during and after the collection.
Our goal at Integrated Test & Measurement is to provide efficient testing solutions and services to address your company’s needs. If you need to measure high channel counts, or have questions about our rugged DAQ systems, software, rental equipment or testing services, then please contact ITM by phone or e-mail.
Contact Information: For more information on this Article, please visit iTestSystem.com or contact: Ryan Welker – Integrated Test & Measurement (ITM), LLC – ryan.welker@itestsystem.com or (844) 837-8797
A proprietary monitoring technology developed by Integrated Test & Measurement is introducing a brand new approach to address “fouling” in coal-fired power plants as well as the pulp and paper industry.
Proprietary Technology from ITM provides boiler operators with insight into boiler and sootblowing efficiency.
Finding efficiency improvements and uncovering hidden unsafe conditions in a process can prevent injury and save your company millions.

ITM stake holders, we have recently received good news from the US Patent Office. They have recently allowed claims relating to the use of vibration measuring devices to evaluate the operation of a sootblower (US20190041201A1). This allowance strengthens the protection of the sootblower health and fouling detection features of ITM’s Sootblower Fouling Detection (SFD) Technology.
Additional Claims: “A method of evaluating an operation of a sootblower in a boiler system, the method comprising: operating a sootblower having a rotating lance tube; measuring a vibration in the boiler system caused by the operation of the sootblower, wherein the vibration is measured with a vibration measuring device; and analyzing the measured vibration to evaluate the operation of the sootblower.”
US Patent #: US20190041201A1
For more information about ITM’s SFD Technology or other Boiler Monitoring Systems, contact Ryan Welker @ (844) 837-8797 x702
Related Links

Sang-Soo Kim is used to overcoming bumps in the road. After all, his career is centered on developing technology that improves pavement conditions.
The Ohio University researcher and civil engineering associate professor was facing a fast-approaching deadline to prove his novel asphalt testing device was worthy of startup funding from the state of Ohio when he turned to Integrated Test & Measurement (ITM) for help.
The preeminent researcher had a challenge for Chase Petzinger, ITM software engineer. His scratch-built device — essentially an extreme oven/freezer combo that heats or freezes pucks of asphalt material to force expansion or contraction — needed complex hardware and a custom software solution to control signals from the device and ultimately record asphalt cracking data.
“I was extremely happy and impressed with ITM’s technical skills,” said Kim. “I was on a very tight schedule to finish the project in time, and they were very flexible and accommodating to my needs.”
The job required ITM’s team to develop software to record data from National Instruments hardware as well as control and monitor a custom built Watlow Programmable Logic Controller. In addition, the team had to design and build an enclosure that held all the data acquisition equipment and did all the power-cable management signal conditioning.
“So he had the oven shipped to us, and then he showed up with a big box of all the stuff that he had brought,” recalls Petzinger. “He set it down and said, ‘Okay, make this work.’”
Specific sensors and fixtures included GT1000RA LVDT Sensors, NTC-6000 signal conditioners, RDP S7AC signal conditioners and custom-built stainless-steel fixtures. In addition, the data acquisition process required employing a NI cDAQ-9174 Chassis, NI-9216 RTD modules as well as an NI-9209 Voltage Module.
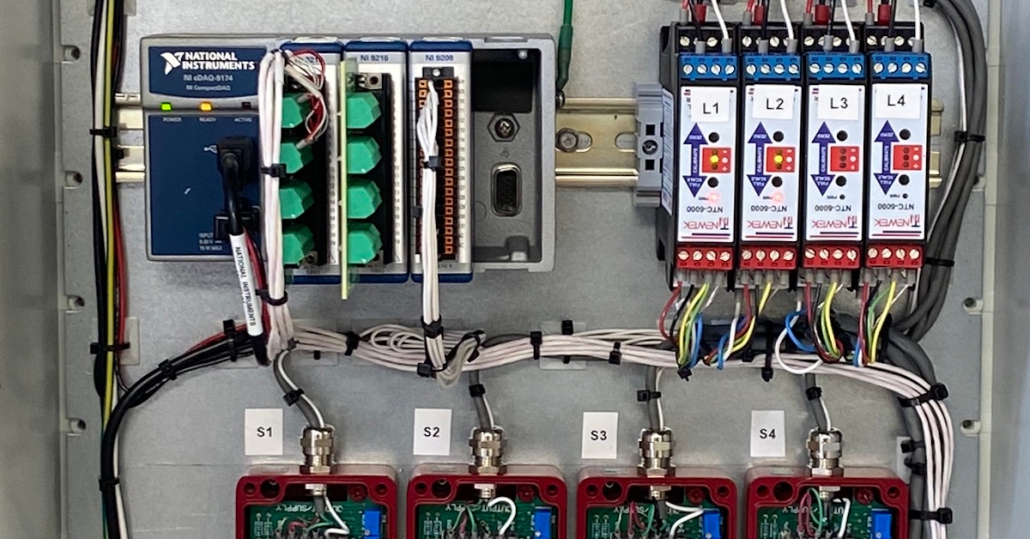
Petzinger explained that he was able to customize the software application using LabVIEW to both collect the data from the sensors inside the oven as well as directly communicate with the device to control start and stop functions as well as the temperature inside.
“I think there were about 50,000 rows in this Excel document of different commands and ways that I could talk to the device,” said Petzinger. “I had to figure out how to use that information and then start from scratch writing a program that would send the commands that the oven could actually interpret.”
Petzinger considers these types of automation and data logging applications a melding of both science and art.
“We were able to create an application to communicate with a unique piece of hardware that we had never seen before,” he said. “if you have your own proprietary oven or switch or machine or something, we’ve worked with unique applications before, and we can do it again.”
Thanks to ITM, Kim not only was able to present his device to the Ohio Department of Development, but it outperformed even his own expectations.
“We wanted to demonstrate this testing device is indeed able to predict low-temperature performance,” he said. “We ran the test with the device that ITM made, and we had one of the best correlations I’ve seen in an asphalt pavement study.” Kim says ITM helped him prove that his device can predict which mixtures of asphalt will crack more accurately than existing tests. And, importantly, it will yield results in a single day where traditional asphalt studies take a week or longer. Next up in his effort to commercialize the unit, Kim intends to publish the results of his work in industry publications, and he’s already seeking a patent.
For more information about this project or other LabVIEW development projects contact Mark Yeager @ (844) 837-8797 x701

I’m excited to announce that our team is growing with the addition of Zach Strong. After graduating in May of 2020, Zach recently moved from Co-Op to a full-time engineering technician position. Zach’s primary role as an engineering technician is to assist with industrial monitoring solution installations and field testing applications. In addition to his work in the field, Zach works in our instrumentation lab assembling and testing custom control panel assemblies, installing strain gauges on customer components, and building and testing customer monitoring and measurement systems.
We welcome Zach to our team. You can read more about our entire team here.
— Vice President of Operations – Ryan Welker
ITM | Integrated Test + Measurement
227 Water Street, Suite 300
Milford, OH 45150
Phone: 1.844.TestSys
Fax: 513.248.8453
Email: ITM Sales

ITM provides software development, structural and mechanical testing services, industrial monitoring, strain gauging, and data analysis solutions to clients on six continents. ITM is a recognized National Instruments Gold Alliance Partner.
