ITM Helps Pave Way to Better Asphalt Testing

Sang-Soo Kim is used to overcoming bumps in the road. After all, his career is centered on developing technology that improves pavement conditions.
The Ohio University researcher and civil engineering associate professor was facing a fast-approaching deadline to prove his novel asphalt testing device was worthy of startup funding from the state of Ohio when he turned to Integrated Test & Measurement (ITM) for help.
The preeminent researcher had a challenge for Chase Petzinger, ITM software engineer. His scratch-built device — essentially an extreme oven/freezer combo that heats or freezes pucks of asphalt material to force expansion or contraction — needed complex hardware and a custom software solution to control signals from the device and ultimately record asphalt cracking data.
“I was extremely happy and impressed with ITM’s technical skills,” said Kim. “I was on a very tight schedule to finish the project in time, and they were very flexible and accommodating to my needs.”
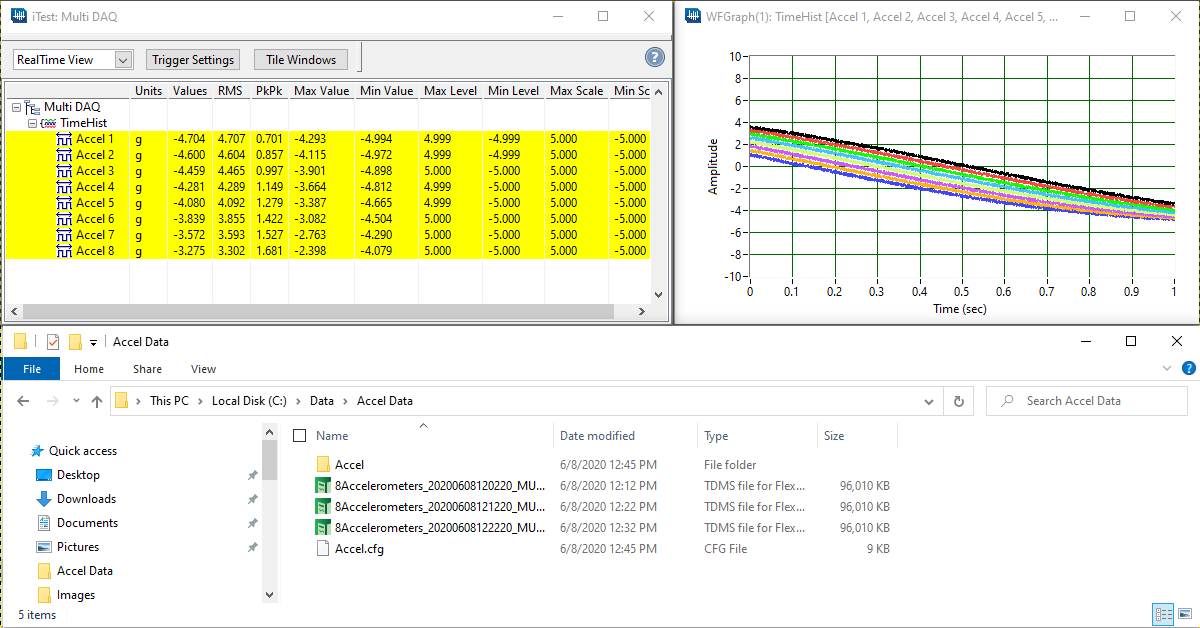
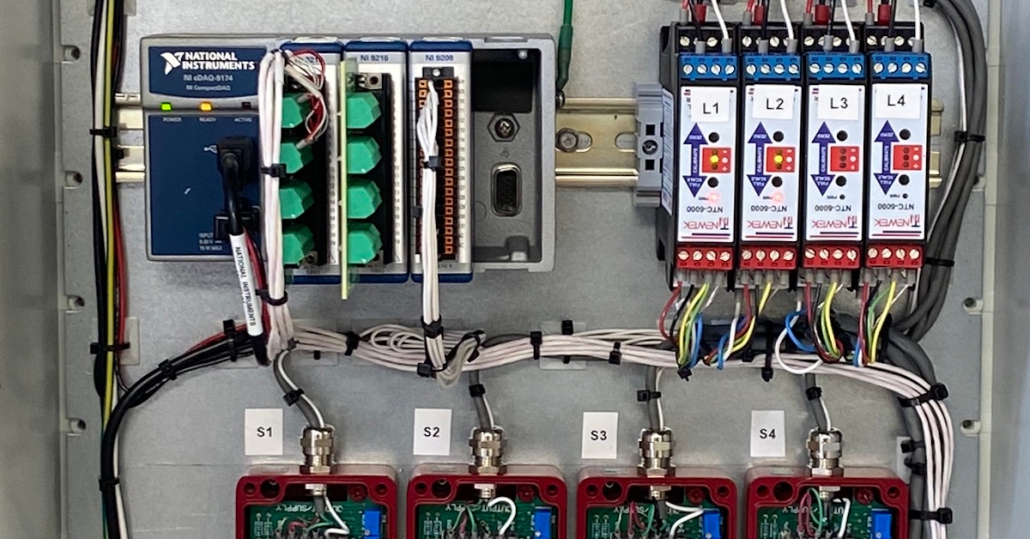
The job required ITM’s team to develop software to record data from National Instruments hardware as well as control and monitor a custom built Watlow Programmable Logic Controller. In addition, the team had to design and build an enclosure that held all the data acquisition equipment and did all the power-cable management signal conditioning.
“So he had the oven shipped to us, and then he showed up with a big box of all the stuff that he had brought,” recalls Petzinger. “He set it down and said, ‘Okay, make this work.’”
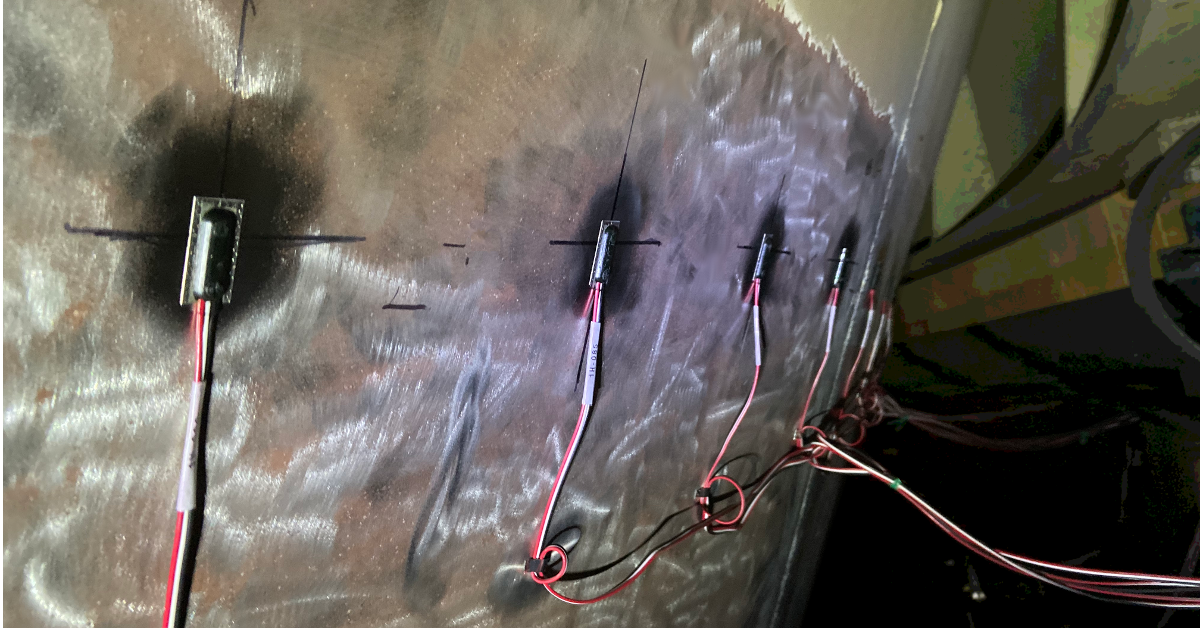
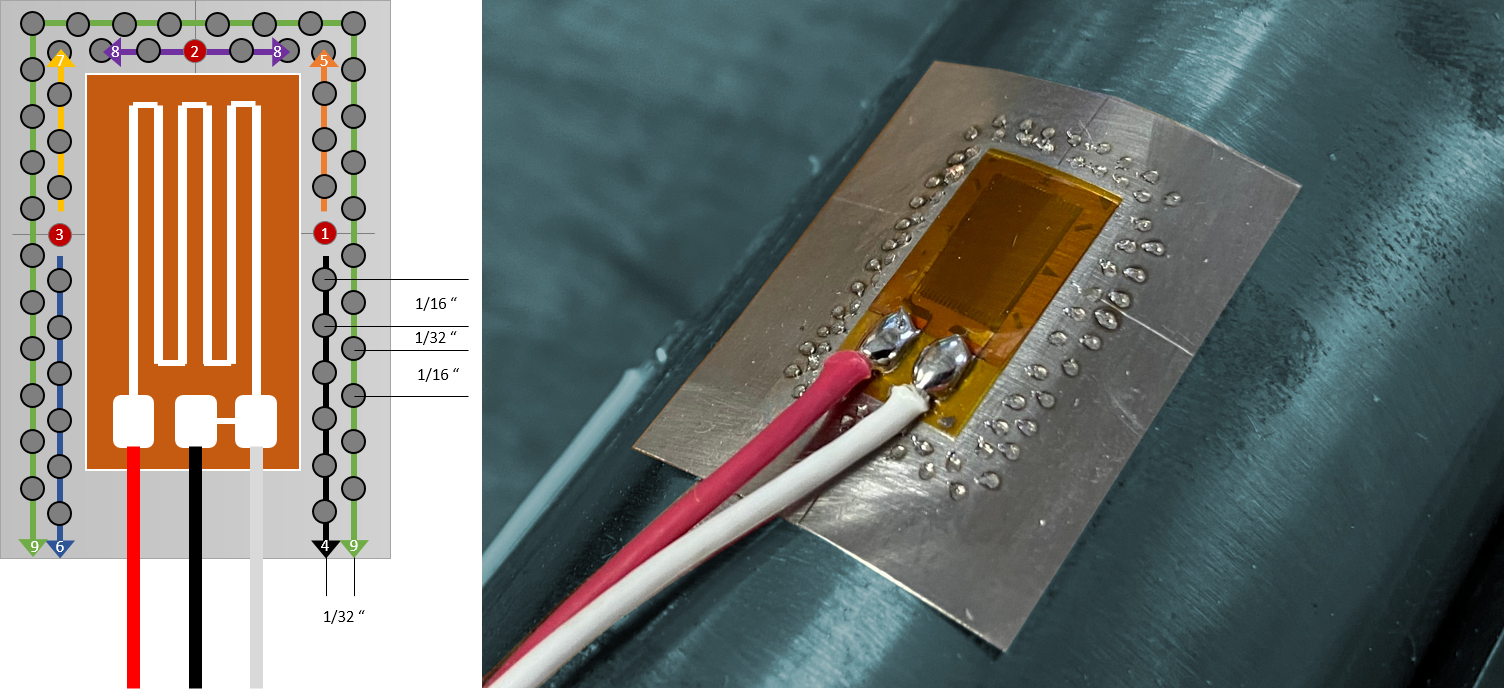
Specific sensors and fixtures included GT1000RA LVDT Sensors, NTC-6000 signal conditioners, RDP S7AC signal conditioners and custom-built stainless-steel fixtures. In addition, the data acquisition process required employing a NI cDAQ-9174 Chassis, NI-9216 RTD modules as well as an NI-9209 Voltage Module.
Petzinger explained that he was able to customize the software application using LabVIEW to both collect the data from the sensors inside the oven as well as directly communicate with the device to control start and stop functions as well as the temperature inside.
“I think there were about 50,000 rows in this Excel document of different commands and ways that I could talk to the device,” said Petzinger. “I had to figure out how to use that information and then start from scratch writing a program that would send the commands that the oven could actually interpret.”
Petzinger considers these types of automation and data logging applications a melding of both science and art.
“We were able to create an application to communicate with a unique piece of hardware that we had never seen before,” he said. “if you have your own proprietary oven or switch or machine or something, we’ve worked with unique applications before, and we can do it again.”
Thanks to ITM, Kim not only was able to present his device to the Ohio Department of Development, but it outperformed even his own expectations.
“We wanted to demonstrate this testing device is indeed able to predict low-temperature performance,” he said. “We ran the test with the device that ITM made, and we had one of the best correlations I’ve seen in an asphalt pavement study.” Kim says ITM helped him prove that his device can predict which mixtures of asphalt will crack more accurately than existing tests. And, importantly, it will yield results in a single day where traditional asphalt studies take a week or longer. Next up in his effort to commercialize the unit, Kim intends to publish the results of his work in industry publications, and he’s already seeking a patent.
For more information about this project or other LabVIEW development projects contact Mark Yeager @ (844) 837-8797 x701