Going Old School to Deliver New Solutions
High-tech measurement systems? Not a problem.
Complex data acquisition or custom software solutions? Right in our wheelhouse.
At ITM, these kinds of challenges have become commonplace in our lab, but one recent project that hit our doorstep stretched our engineers, and not for the reasons you may be thinking.
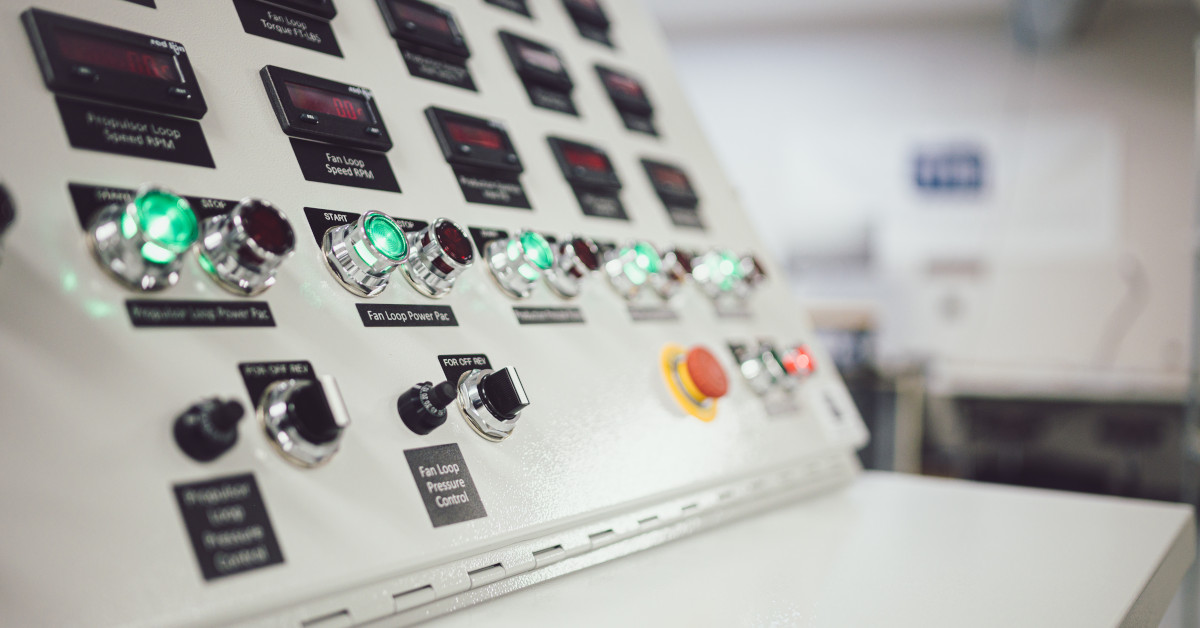
Our customer wanted an old-school manual operator control station. Think classic-style red and green, push-button start and stop controls, which they wanted to energize various parts of a large test cell for a military marine application.
The ask was a bit out of ITM’s typical range of services simply because most systems they develop don’t require manual control stations to run their equipment. Instead, their customers usually opt for computer-controlled testing, which ITM crafts regularly. Still, the job required a complete CAD design, a custom cabinet enclosure and hundreds of electrical components to be designed and assembled, which our team successfully delivered to the satisfaction of the client.
Modern Integration
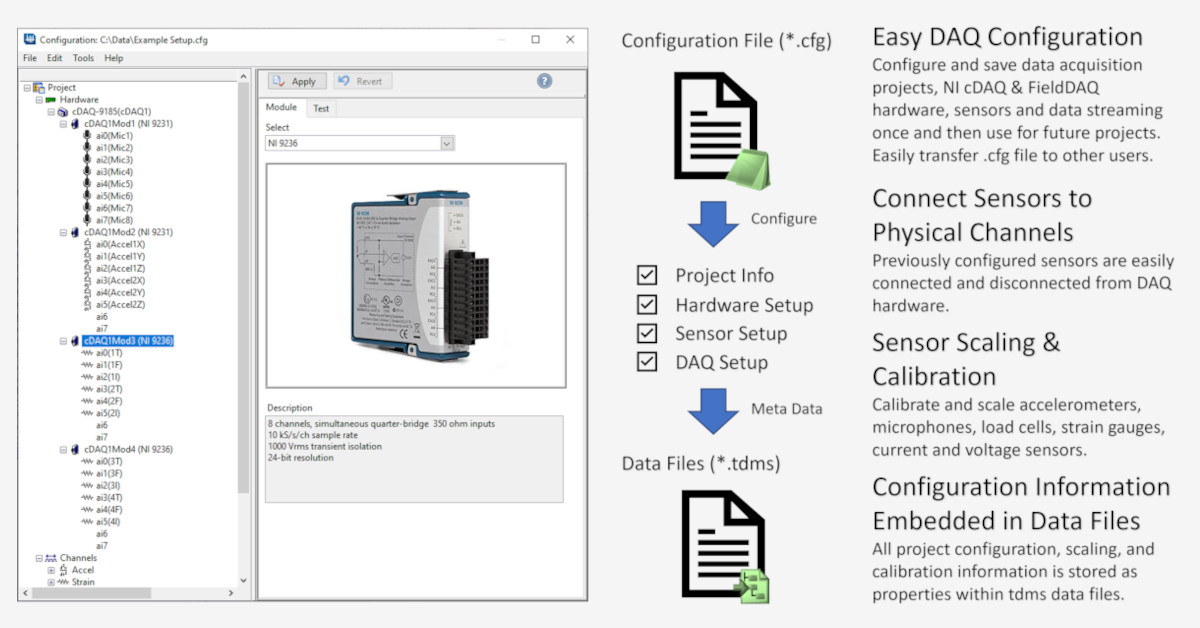
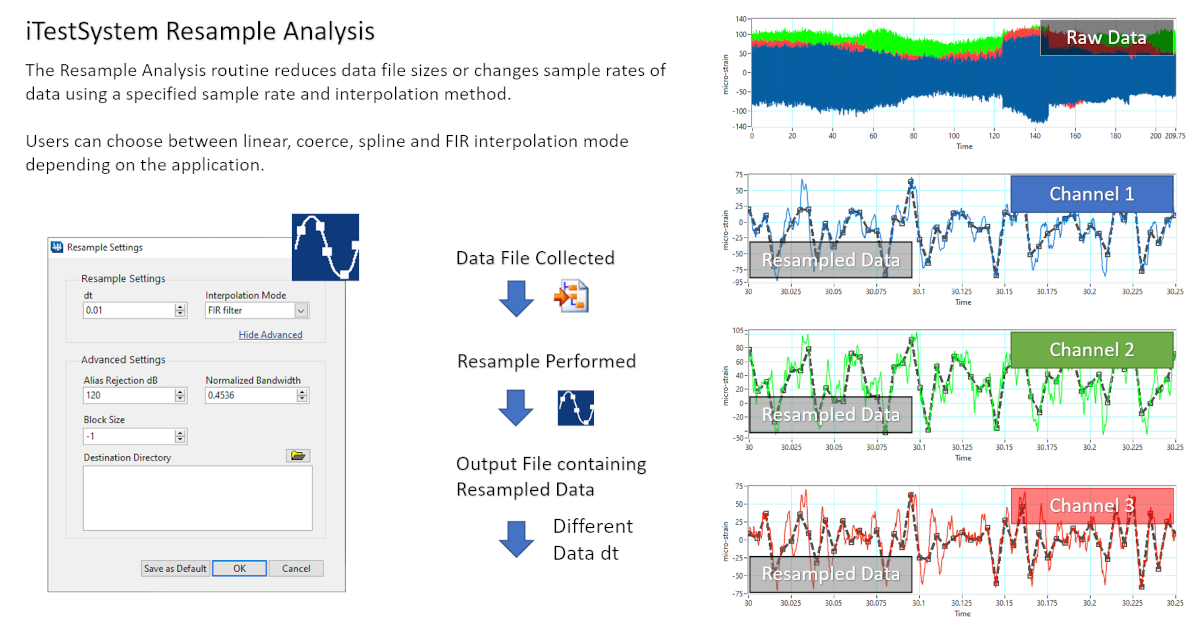
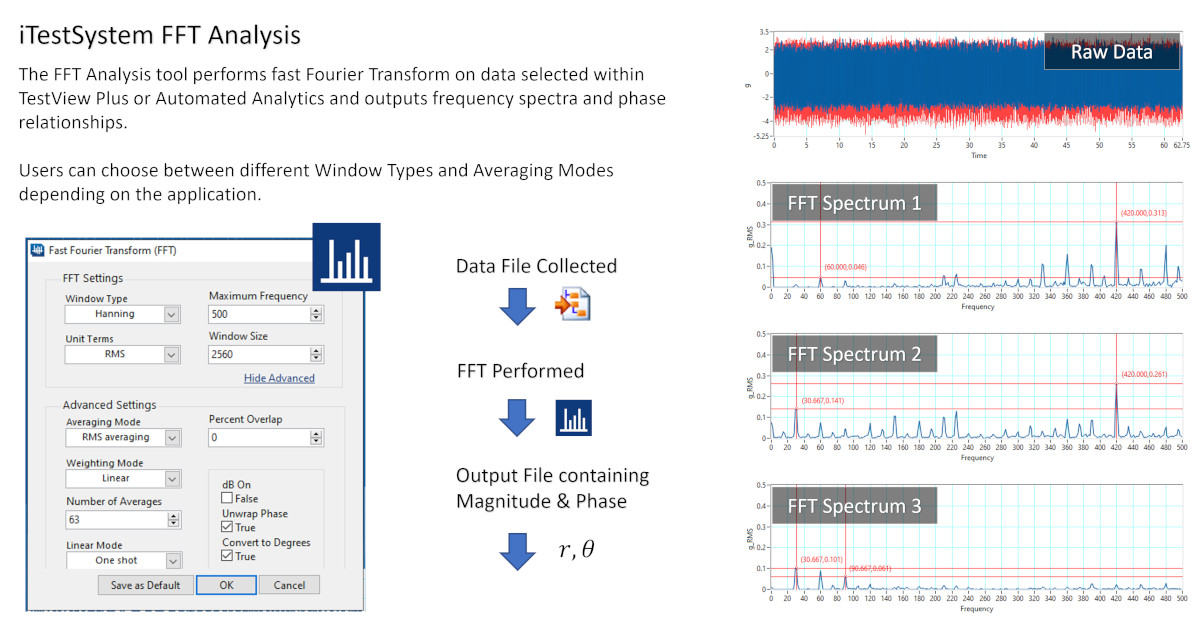
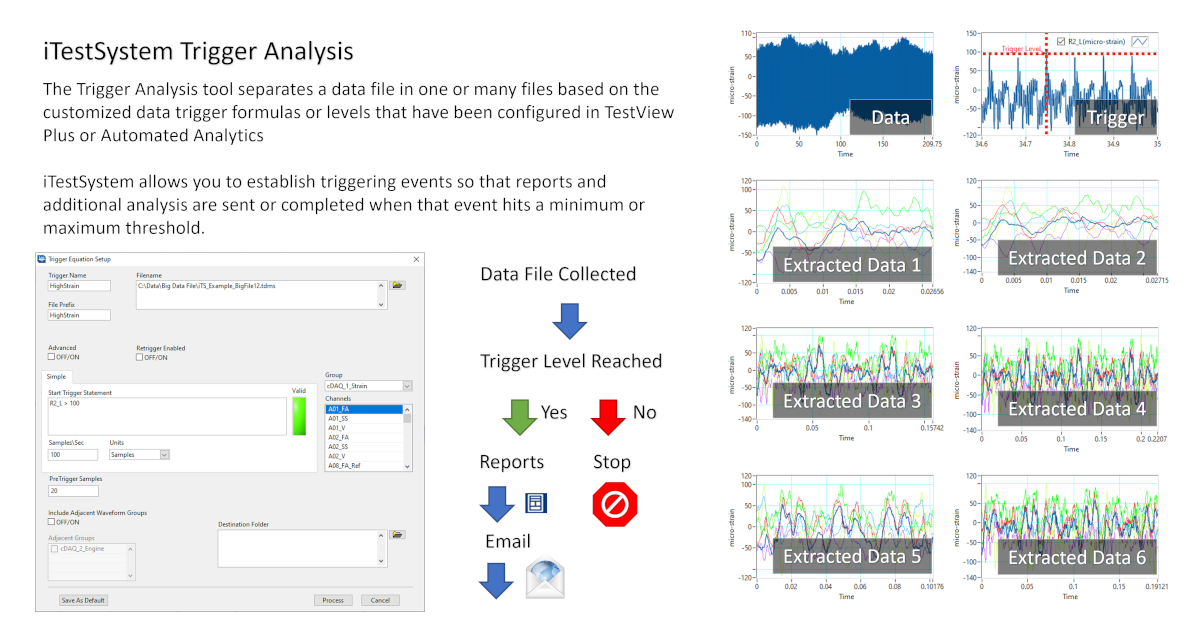
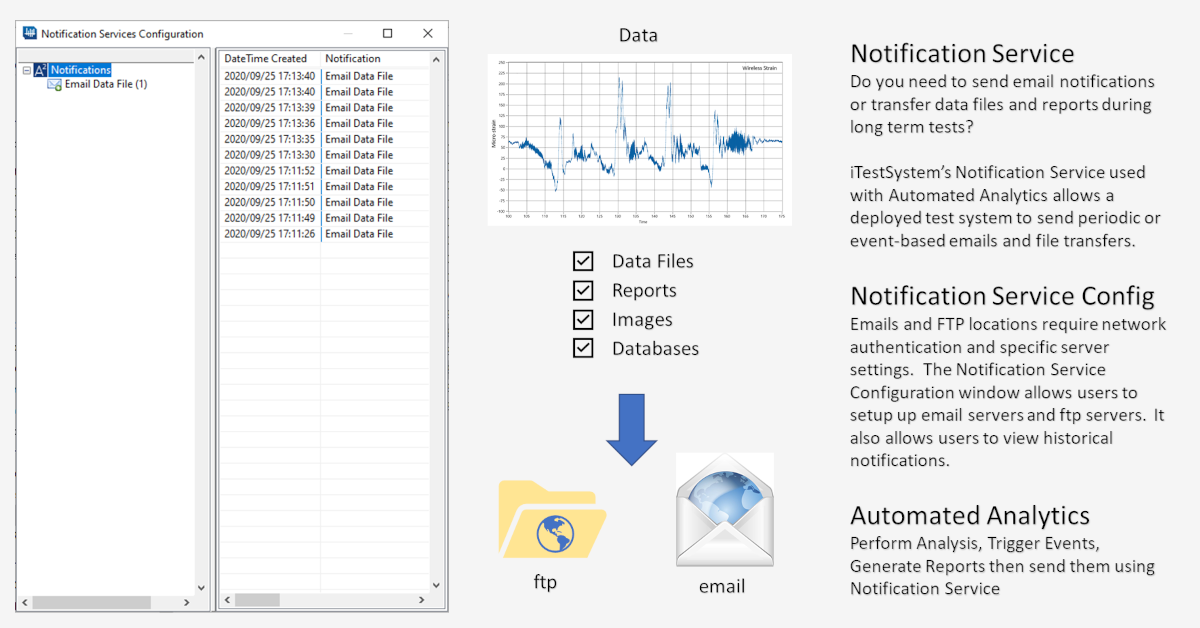
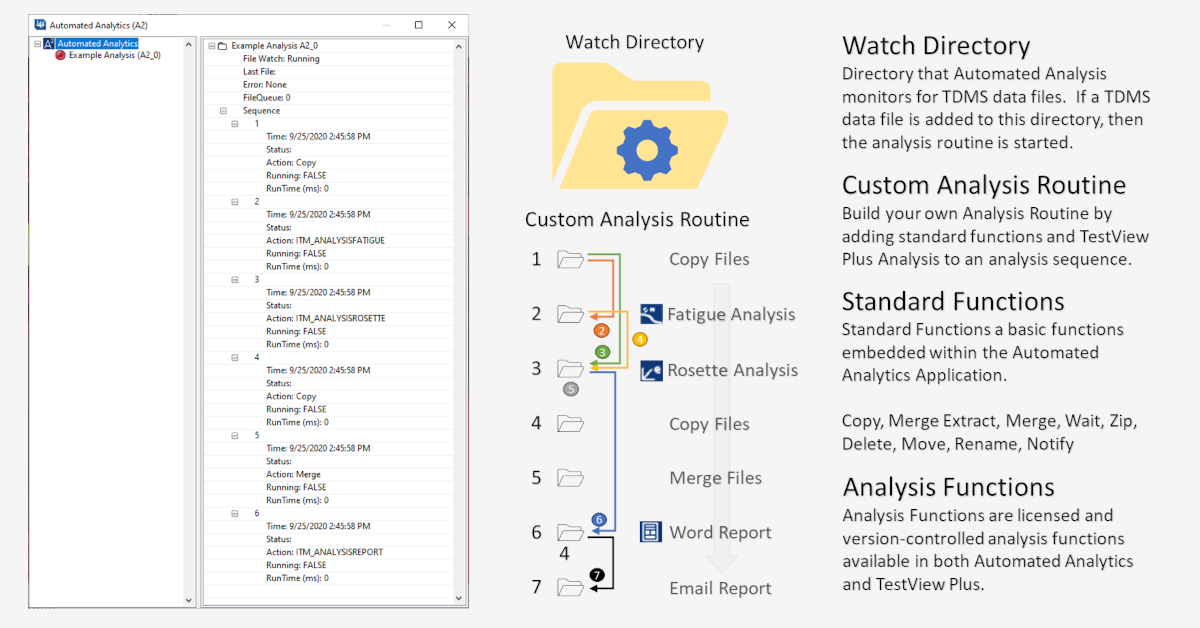
The same customer also wanted to be able to collect complex data from the tests, and ITM, of course, delivered on this challenge as well thanks to its proprietary iTestSystem software, which computer engineer Chase Petzinger deployed to build a custom DAQ.
iTestSystem is an engineering measurement software platform that enables test engineers to organize, acquire, view and analyze data from machinery, processes, vehicles and other complex rugged measurement systems. iTestSystem was specifically designed for use with NI cDAQ or FieldDAQ hardware for data collection and data logging, so it was no stretch to equip it to pull down data from the military equipment test.
In the end, the job required running new-school modern technology to handle the data collection and reporting simultaneously alongside the old-school analog operator control panel. From successfully assembling hundreds of electrical components to deploying custom software that can handle hundreds of channels of data from a wide variety of sensors at once, ITM truly showed its range on this project.
For more information about our iTestSystem or ITM’s testing services, contact Ryan Welker @ (844) 837-8797 x702.

 The Excellence in Impact Award is given annually to one Clermont County business that demonstrates an outstanding contribution to the local economy, and ITM President Tim Carlier was thrilled to have his company recognized, particularly after the challenging year his team has endured.