Quiet Please: ITM Tunes Into Importance of Measuring Sound Levels
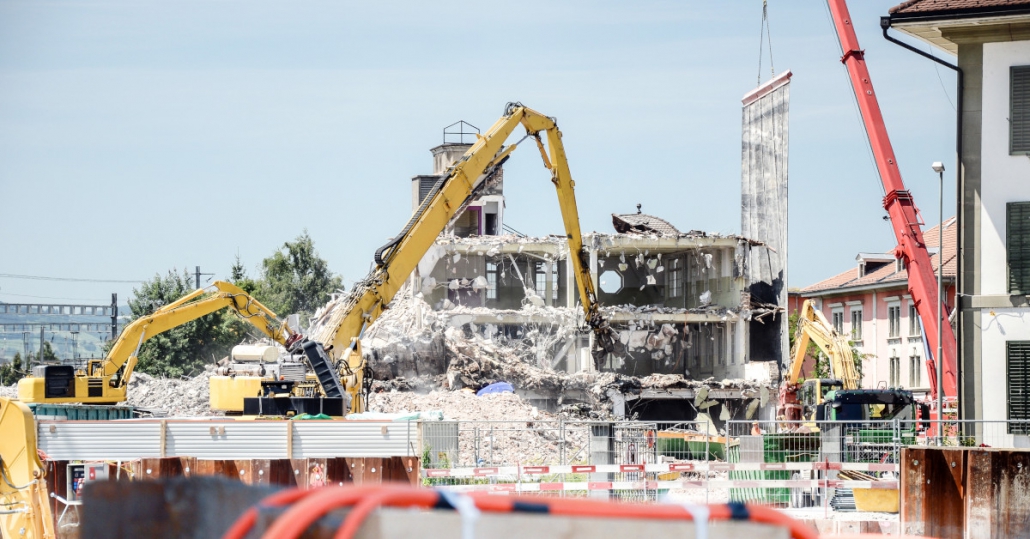
Whether manufacturing vehicles, mining natural resources or operating machinery on a construction site, a single common factor can bring your operation and productivity to an absolute halt.
That factor is noise.
In a world where precision and performance rule, measuring and controlling sound levels can be crucial to the success of your product or project. The team at Integrated Test & Measurement (ITM) have developed a customized solution that not only measures and collects sound-level data, but will help your team identify the specific components causing all that noise.
On-Site Sound Testing Capabilities
ITM can assist with all types of sound testing on site including:
- Vehicle/Automotive Noise Vibration & Harshness (NVH) Testing
- Drive by Noise Testing
- Sound Level Testing
- Vehicle/Automotive Component Noise Testing
- Construction Site Sound/Noise & Vibration Level Monitoring
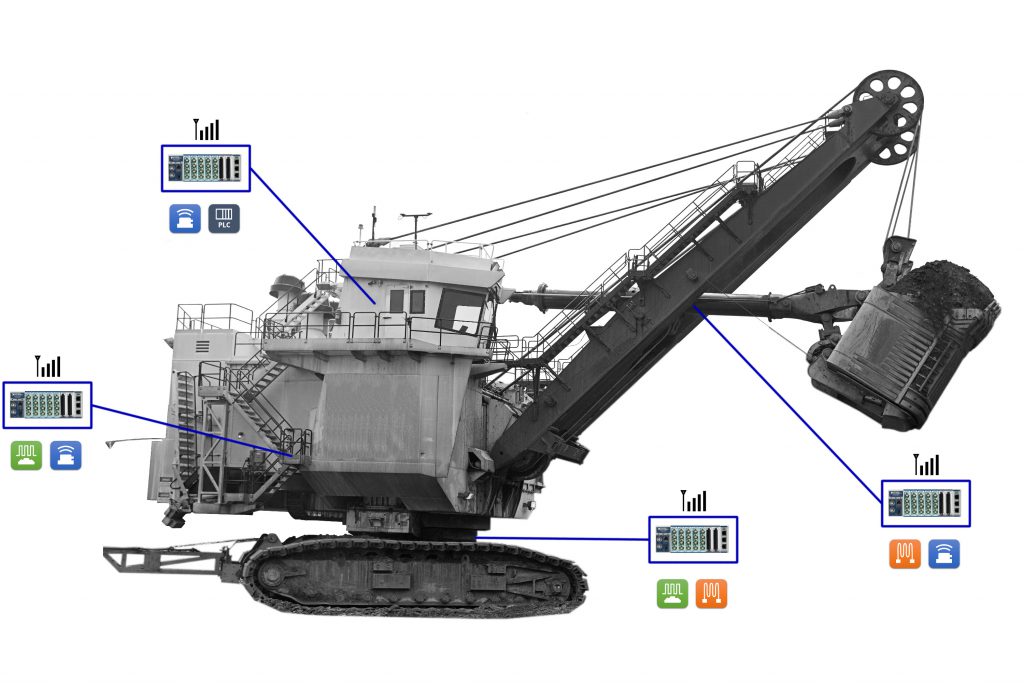
- Mine Sound/Noise & Vibration Level Monitoring
- ISO Noise Testing
- Data Logging
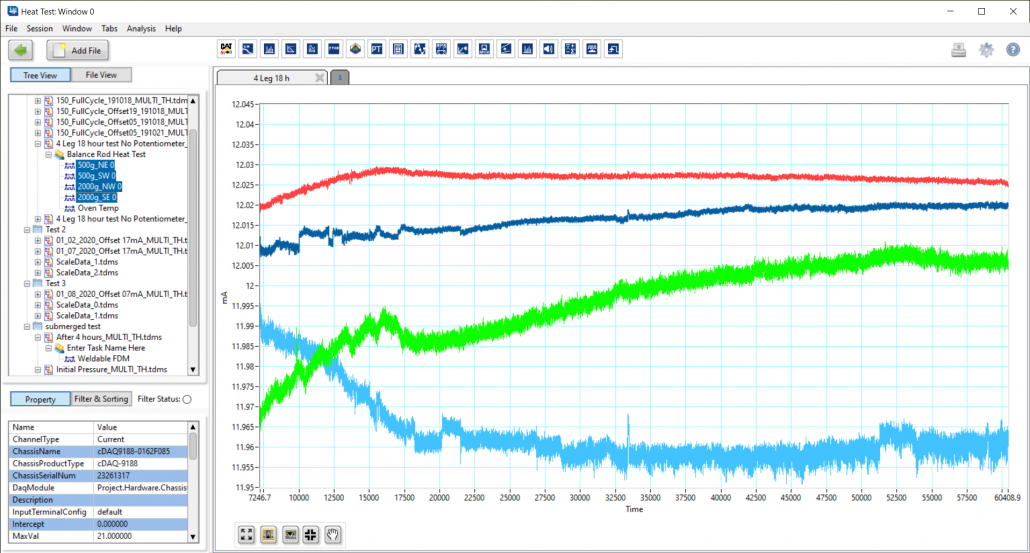
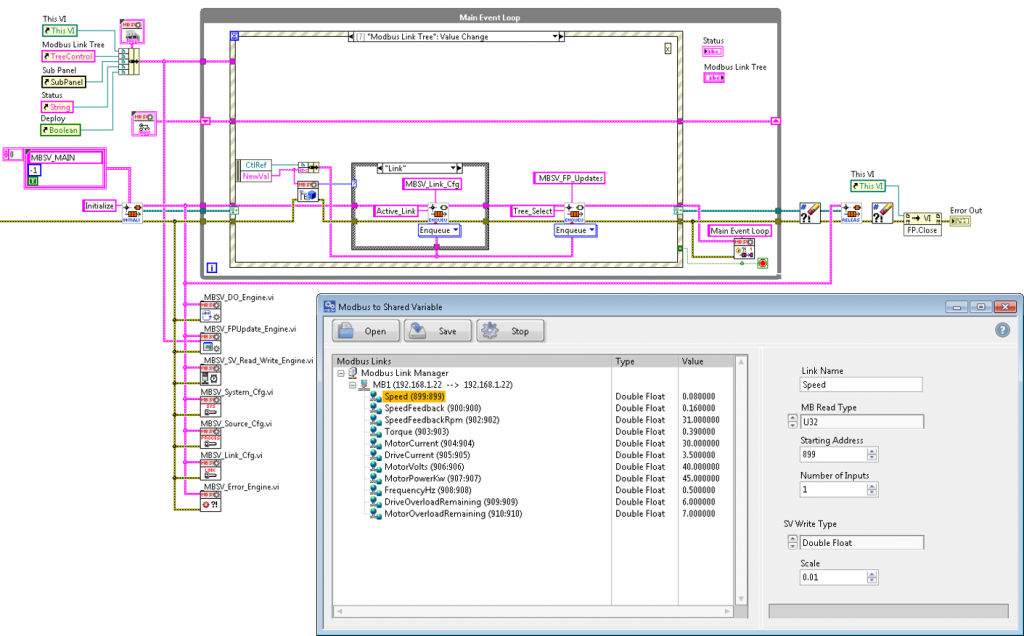
In each of these instances, their engineers will be packing a custom Sound Level Test Kit full of data acquisition hardware, microphones and more. The key to their equipment, however, is that each kit includes ITM’s proprietary iTestSystem software, an intuitive sound-level human machine interface (HMI) that allows for sound-level recording and reporting.
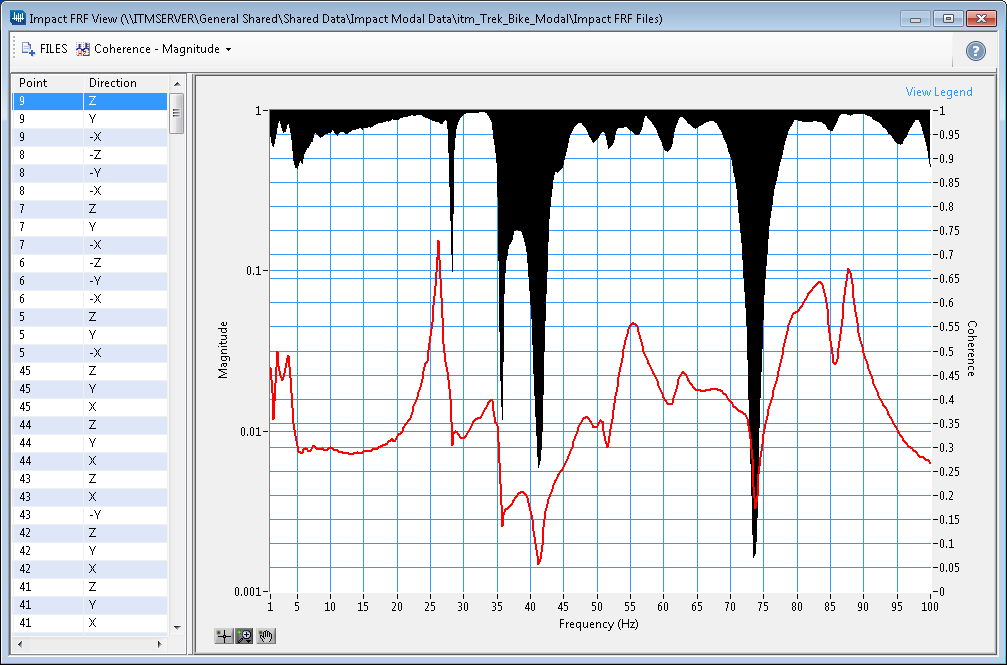
Mark Yeager, ITM Lead Programmer, says building the capability within iTestSystem to measure microphone data now allows customers to look at a real-time display of sound-level measurements.
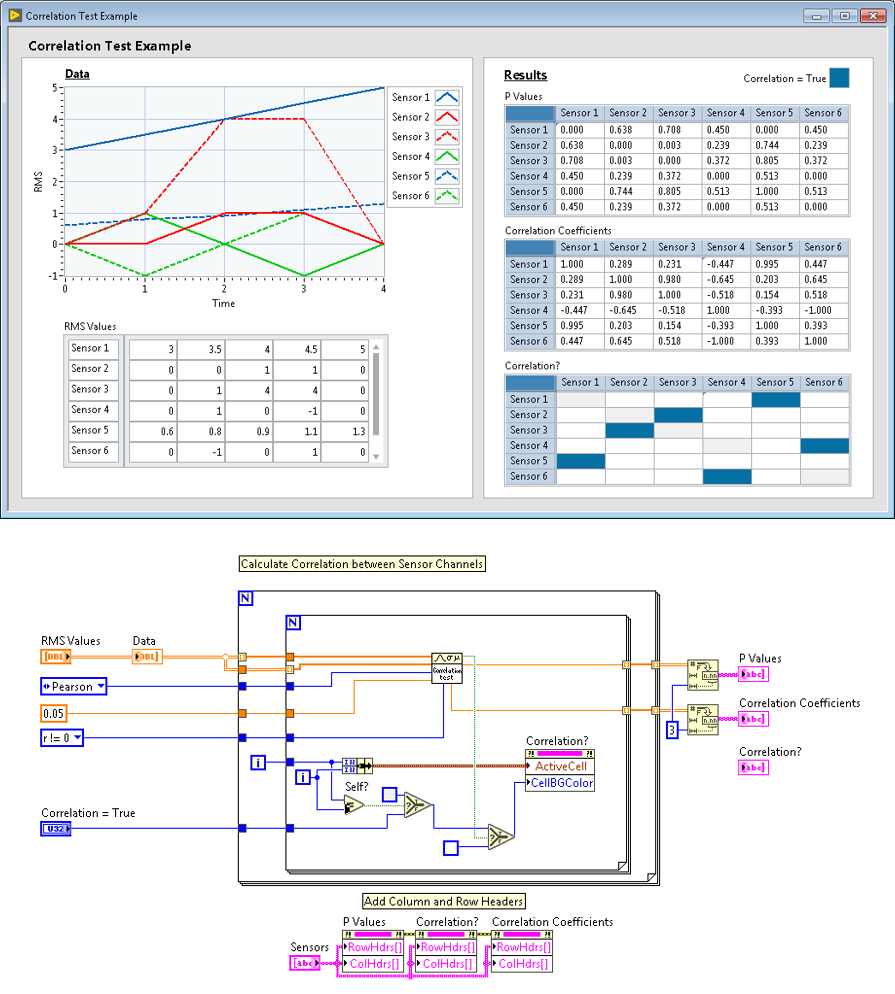
Yeager says their crew can build out tests on site to do such things as measure pass-by noise, a process by which the team arranges mics inside a vehicle and along both sides of a 40-yard stretch then capture, monitor and analyze a vehicle’s sound and compare it to acceptable standards. By breaking apart the frequencies of components, they can even zero in on trouble spots such as a turbocharger on a car or a loud cooling fan on a piece of construction equipment.
Measuring Dangerous Sound
Yeager also points out the need to measure sound in places like construction sites or mines, where there may be concern over hearing loss for operators. According to the Centers for Disease Control, hearing loss can result from a single loud sound (like firecrackers) near your ear. Or, more often, hearing loss can result over time from damage caused by repeated exposures to loud sounds. The louder the sound, the shorter the amount of time it takes for hearing loss to occur. Sound is measured in decibels (dB). A whisper is about 30 dB, normal conversation is about 60 dB, and a motorcycle engine running is about 95 dB. The CDC advises that noise above 70 dB over a prolonged period of time may start to damage your hearing, and loud noise above 120 dB can cause immediate harm to your ears.
Test-Ready Sound Level Kits
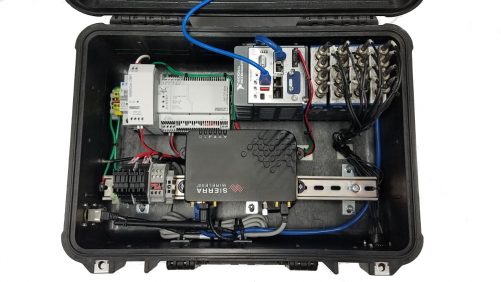
If you have test engineers on-site and simply need the equipment to help you get to the bottom of your sound issues, ITM will ship their test-ready kit that includes a pair of pelican carrying cases packed with the following components:
- ITM’s proprietary iTestSystem software
- Intuitive sound-level human machine interface (HMI)
- Data Acquisition Hardware
- NI cDAQ Chassis
- 8-Channel Microphone Module
- Wireless Switch
- Power Supply
- BNC Connectors
- Network Connectors
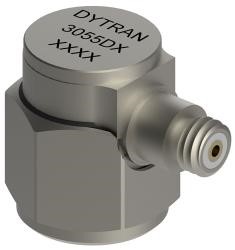
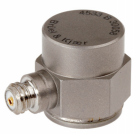
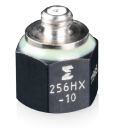
- Sensors
- Six Microphones
- Cables
- Stands
- Accessories
Whether your needs include on-site sound testing and analysis or you simply need the crucial equipment to measure sound and vibration levels yourself, ITM can help.
ITM is a structural test & measurement engineering service and software company located in Milford, Ohio, that helps companies reduce costs and improve efficiencies in their product development, manufacturing, and production activities. ITM is a recognized NI Gold Alliance Partner that provides software development, structural and mechanical testing services, industrial monitoring, strain gauging, and data analysis solutions to clients around the globe.
For more information about sound and noise level testing or our sound level test system or other data collection solutions, contact Ryan Welker via email at ryan.welker@itestsystem.com or phone at (844) 837-8797 x702.