7 Tips for Estimating Test Engineering Services Costs

If the COVID-19 pandemic has proven anything, it is that we live in a business climate where efficiency and accuracy have never been more important. In other words, none of us can afford to make costly mistakes.
With that in mind, I’d like to share some tips for you to consider when it comes to this important question: How Do You Estimate Test Engineering Services Costs?
For engineers, testing engineers and managers who find themselves estimating jobs, getting this step right will prove crucial not only to the success of your projects and bottom line, but also to the trust you build with your clients.
Define the project scope of work
The most important requirement is to properly define the project scope of work. This will not only help you determine the necessary hardware, software, and resources required, but it will also help you identify the customer’s expectations and project deliverables. Properly defining the scope of work will help eliminate or minimize overall project time, as it will prevent delays both during the preparation phase and testing phases. Defining the scope of work will require a deep-dive discussion with your client to fully understand their challenges and goals. Remember not to leave vague language in your proposals. In other words, be sure to define who is responsible to provide all that will be needed to fulfill the project. Without a clear definition of the requirements and deliverables, it leaves a lot open for misinterpretation and expectations.
Materials costs are key
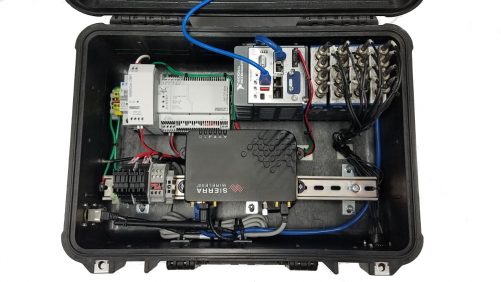
With a properly defined scope, we next must determine what, if any, materials we need to procure. These include sensors, DAQ hardware and other installation supplies. Don’t forget to include the amount of time that will be required to prepare all the materials and hardware. Think through such things as what it will take to package the DAQ hardware for any special environmental requirements. Also, be sure to consider the time it will take you to set up the software configuration file and test all the hardware and sensors prior to deployment.
Onsite costs are relative
We also need to consider the onsite testing requirements and location specifics. Costs can mount quickly to cover general travel and living expenses, particularly when the job will take your team to remote places for extended periods of time. You need to think about daily commutes to and from the facility as well as the cost variance for different geographic locations. Flights, vehicles, hotels and meals are crucial to estimate as accurately as possible, and that’s going to take extra research on your part. Keep in mind that travel costs are NOT one-size-fits-all.
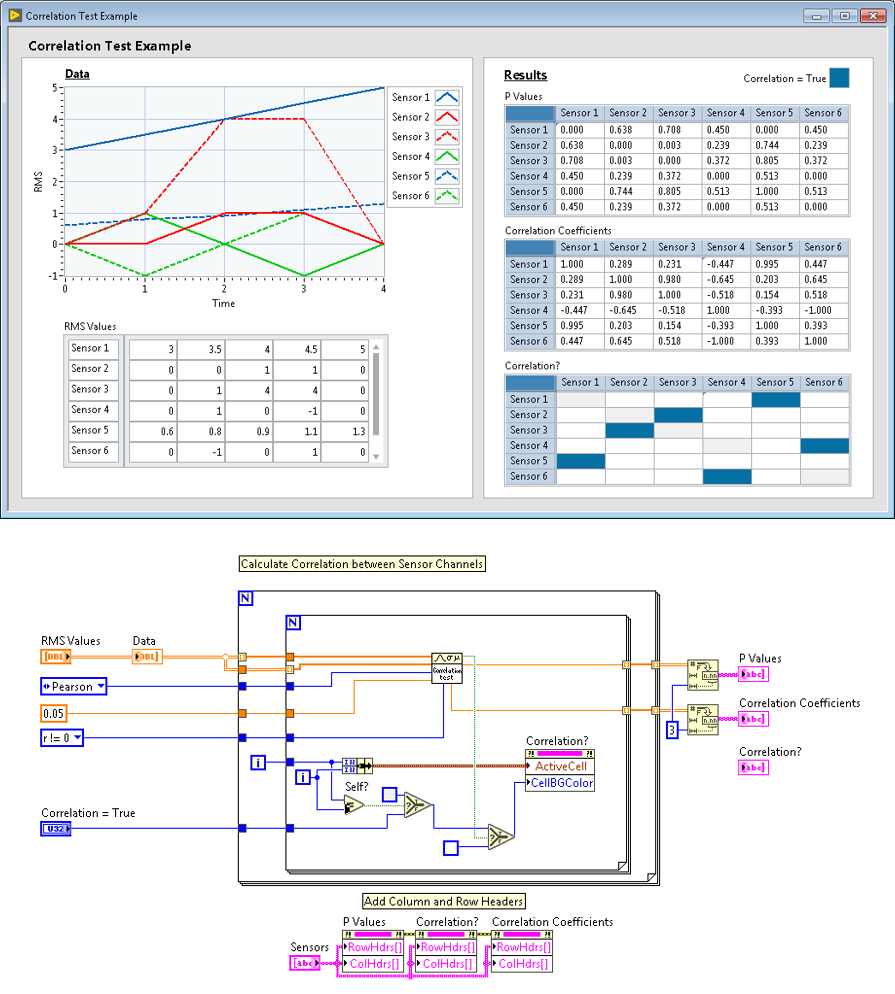
Build in the value of analysis
Some projects require analysis support and some do not. It all depends on the customers’ resources and requirements. We serve customers by providing raw data files and allow them to perform their own analysis, but we also have experience providing a complete turnkey solution including data analysis. This requirement obviously needs to be defined up front in order to accurately estimate the opportunity.
Hidden costs are crucial
You need to consider everything when estimating a project, and this commonly involves “access to the instrumentation areas” for our projects. We typically work on large, complex equipment that sometimes require additional tools and resources to access the sensor locations. This could include manlifts, scissor lifts, cranes, rope access and scaffolding. Since the equipment is quite large, you need to think about the amount of signal cable required and evaluate that against deploying a network of DAQ chassis which may be a cheaper solution than routing all sensors back to a single DAQ system. It will also be key to build in language and costs in your estimates to address unforeseen delays. For example, include factors that lie outside of your team’s control — resources not being available, no access to equipment, or even poorly performing equipment that will not allow your team to record good data.
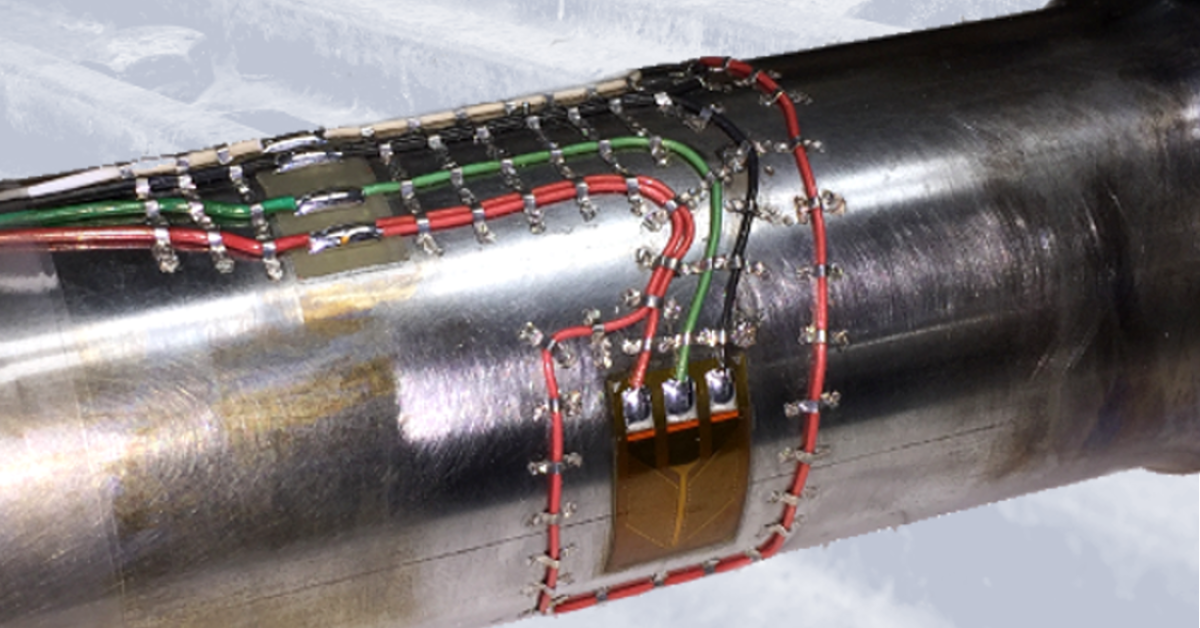
All sensors and gauges are NOT created equally
Sensor installation can vary from a couple minutes to a couple hours depending on the application. The same is true of strain gauges. Depending on the testing environment, strain gauges can be installed quickly or become an arduous task. Some applications involve very high temperature and moisture concerns and may also need to survive for long periods of time, which may require a more robust epoxy that requires a heat cure before data can be recorded from the strain gauges. Some applications involve no environmental concern and are only needed for a very short duration. In these cases, the gauges can be installed quickly after surface prep using an industrial type fast curing epoxy. Similarly, some applications may benefit from using weldable gauges that can simply be tack welded to the specimen. This eliminates any challenges and reduces installation time by using special epoxies. These are typically much more expensive, so you must evaluate the economics of this option. In either case, the surface must be properly prepped (ground, sanded, polished) to the base material to ensure a good bond to the test piece.
Consider variable labor and expense rates
Our labor rates vary by skill level. Senior engineering and programming labor, for example, costs more per hour than our regular engineering and programming labor. Similarly, sending a senior technician will cost more per hour than a technician. Finally, as is common, materials and expenses are estimated at cost plus 10%. Labor Rates Link
For more information about our testing services, contact Ryan Welker @ (844) 837-8797 x702.
Ryan Welker is a 25-year veteran in engineering, procurement and project management. Ryan currently serves as a Vice President of Operations at Integrated Test and Measurement (ITM) in Milford, Ohio. In this role, he oversees the daily operations and monitors all phases of project fulfillment, including customer inquiries, proposal development, scheduling and manpower, employee training, on-site installations, customer follow-up, and support.
Recent News: Ohio University Asphalt Cracking Prediction System Project