In Vehicle Vibration Testing
building a rugged and flexible in-vehicle testing solution to measure the vibration levels.

The automotive category contains case studies and blogs related to ITM’s engineering and testing services for automobile design and manufacture.
building a rugged and flexible in-vehicle testing solution to measure the vibration levels.
…more than a thousand miles away. A display of gauges, needles and dials showed precisely how their product performed during every day over-the-road stress.
High-tech measurement systems? Not a problem.
Complex data acquisition or custom software solutions? Right in our wheelhouse.
At ITM, these kinds of challenges have become commonplace in our lab, but one recent project that hit our doorstep stretched our engineers, and not for the reasons you may be thinking.
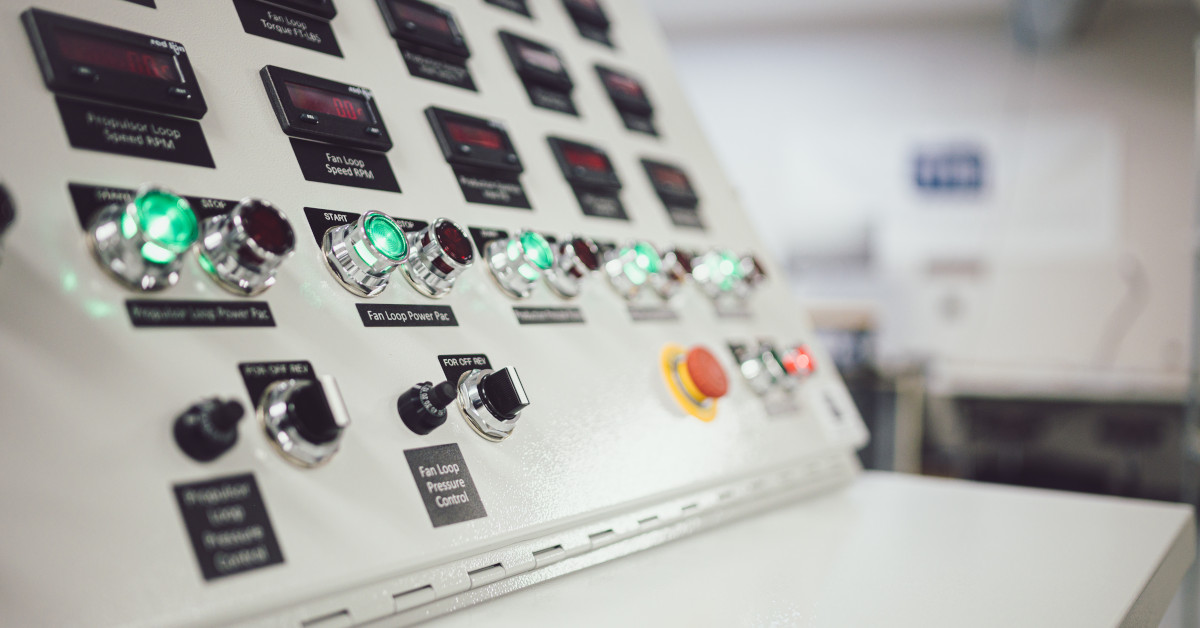
Our customer wanted an old-school manual operator control station. Think classic-style red and green, push-button start and stop controls, which they wanted to energize various parts of a large test cell for a military marine application.
The ask was a bit out of ITM’s typical range of services simply because most systems they develop don’t require manual control stations to run their equipment. Instead, their customers usually opt for computer-controlled testing, which ITM crafts regularly. Still, the job required a complete CAD design, a custom cabinet enclosure and hundreds of electrical components to be designed and assembled, which our team successfully delivered to the satisfaction of the client.
Modern Integration
The same customer also wanted to be able to collect complex data from the tests, and ITM, of course, delivered on this challenge as well thanks to its proprietary iTestSystem software, which computer engineer Chase Petzinger deployed to build a custom DAQ.
iTestSystem is an engineering measurement software platform that enables test engineers to organize, acquire, view and analyze data from machinery, processes, vehicles and other complex rugged measurement systems. iTestSystem was specifically designed for use with NI cDAQ or FieldDAQ hardware for data collection and data logging, so it was no stretch to equip it to pull down data from the military equipment test.
In the end, the job required running new-school modern technology to handle the data collection and reporting simultaneously alongside the old-school analog operator control panel. From successfully assembling hundreds of electrical components to deploying custom software that can handle hundreds of channels of data from a wide variety of sensors at once, ITM truly showed its range on this project.
For more information about our iTestSystem or ITM’s testing services, contact Ryan Welker @ (844) 837-8797 x702.
A large-engine manufacturer had test cells with severe vibration levels…
Automotive and off-highway engineers and designers often need to log vehicle bus data along with vibration, strain gauge, and other sensor data during normal operation to evaluate their design. Using data from all these sources enables these engineers and designers to pinpoint a vehicle’s response to staged or damaging events. For example, engineers can see how steering wheel position and speed effect structural response when the vehicle hits a pothole.
How does steering wheel position and speed effect structural response when the vehicle hits a pothole?
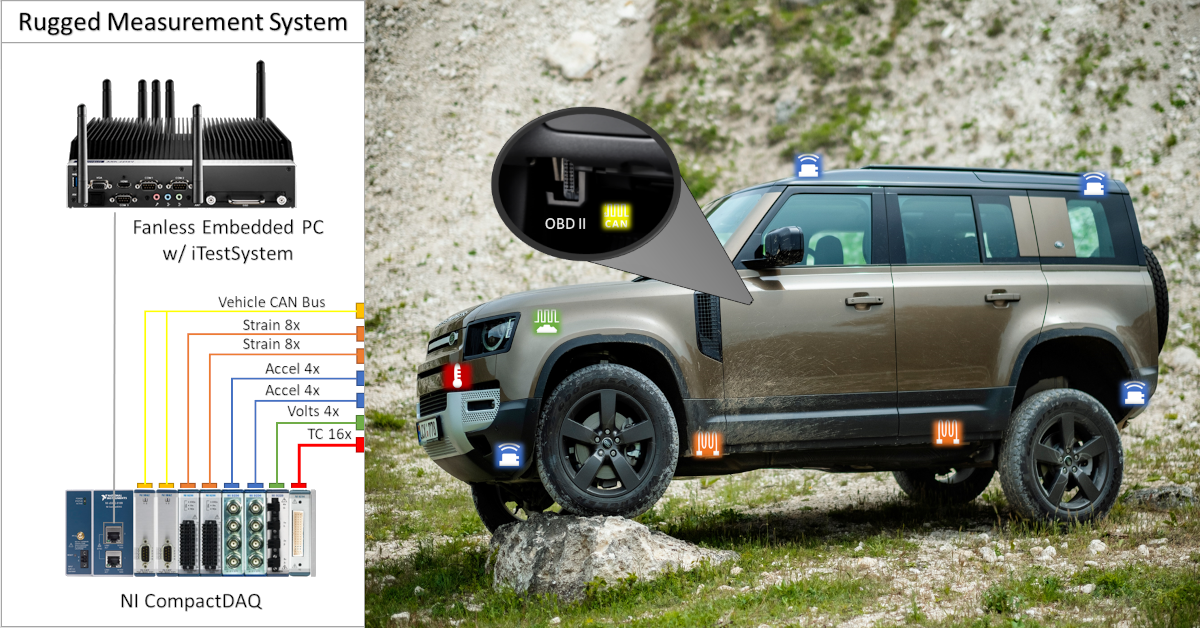
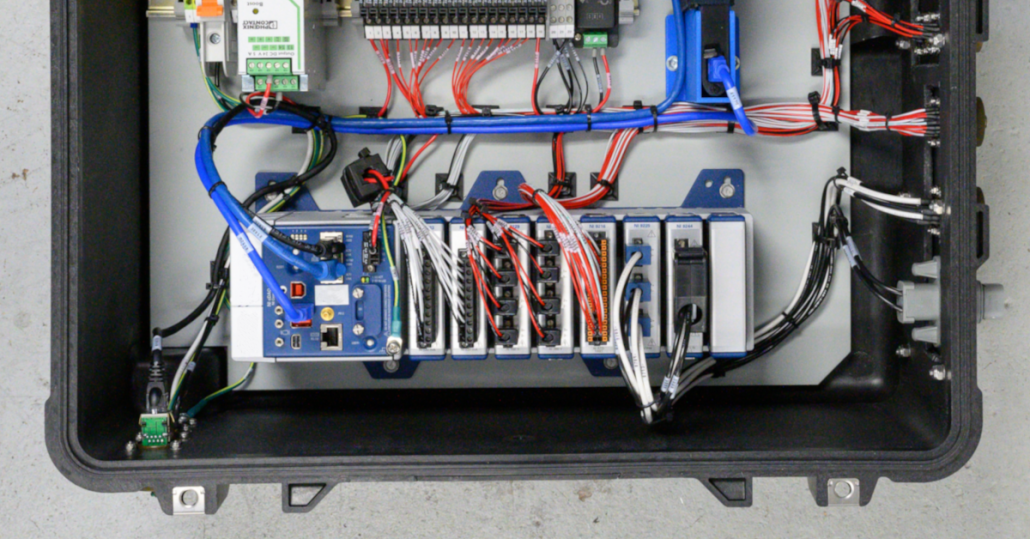
In situations where our engineers need to tap into the vehicle’s on-board diagnostics using CAN bus data and analog sensor data to identify and solve a problem, we will deploy a rugged measurement solution based on NI CompactDAQ (cDAQ) hardware. These systems usually include an industrial compact pc or standalone cDAQ running the iTestSystem engineering measurement application. iTestSystem logs data from the vehicle bus connected to NI 9862 CAN module and other analog sensors connected to NI cDAQ modules like NI 9234, NI 9236, and NI 9229 into one data file.
NI 9862 CAN Module Specifications and Connections
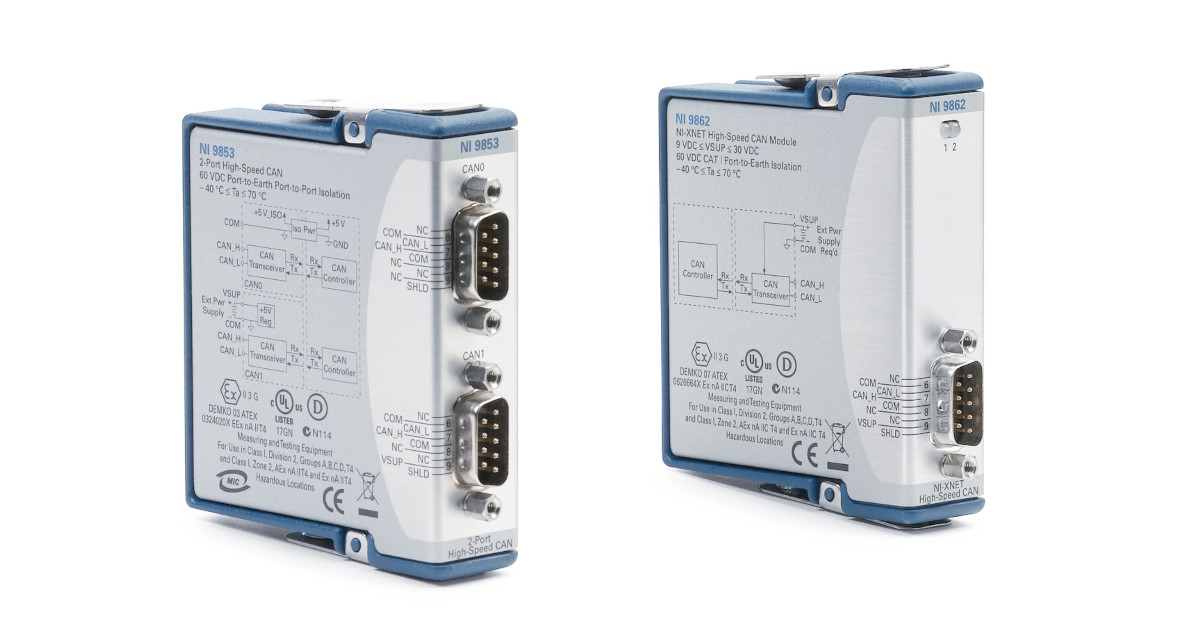
According to the NI data sheet, the NI 9862 modules is a single CAN port device that is isolated from the other modules in the system. The port has a Bosch DCAN CAN controller that is CAN 2.0B-compatible and fully supports both 11-bit and 29-bit identifiers. The port also has an NXP TJA1041AT High-Speed CAN transceiver that is fully compatible with the ISO 11898 standard and supports baud rates up to 1 Mbps. This module requires +9 to +30 VDC supply voltage to operate.
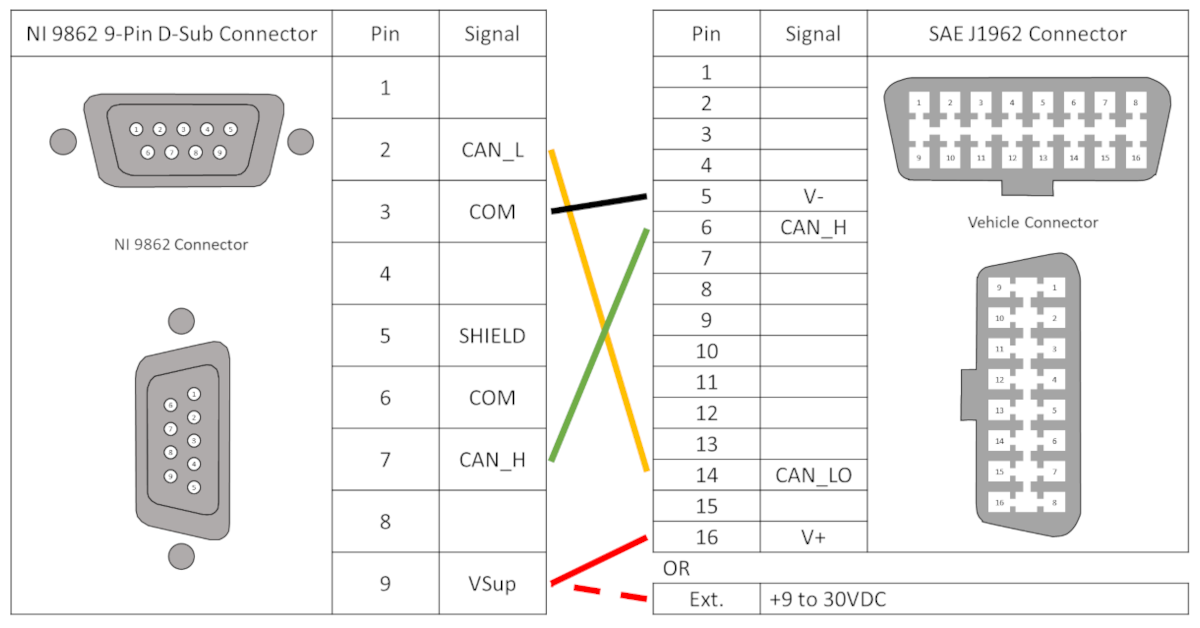
The table below shows the connections between the NI 9862 9 pin D-Sub and the SAE J1962 connector that are required for CAN communication. NI sells a OBDII9M-DB9F CAN Cable cable if you don’t want make your own cable.
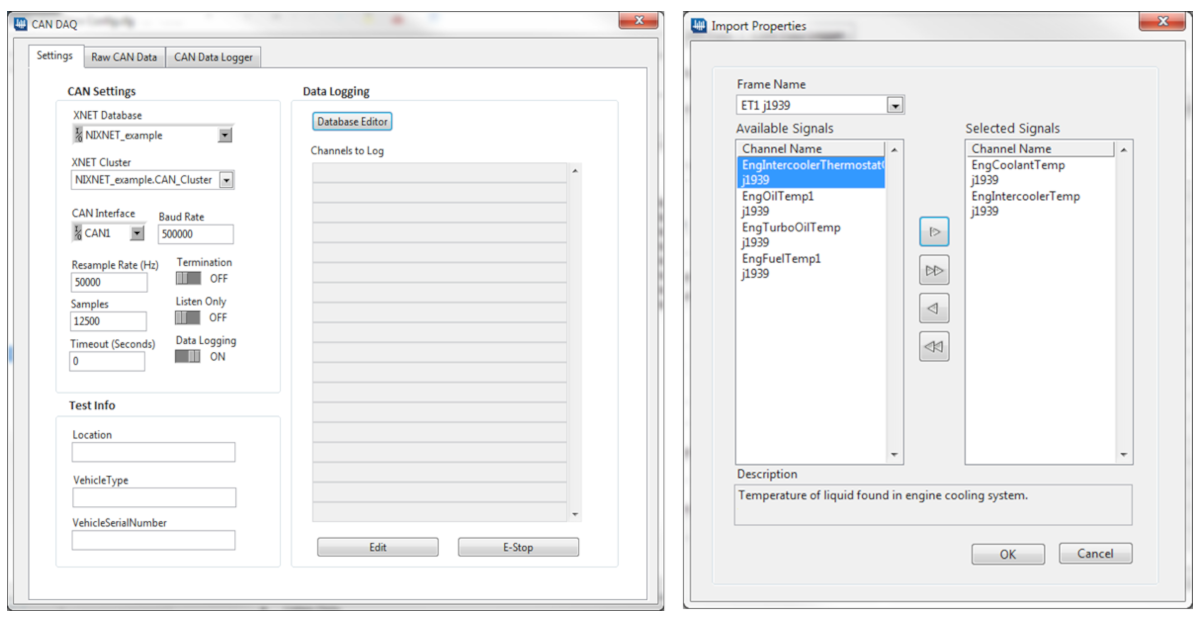
iTestSystem CAN Channel Setup
Setting up a vehicle CAN bus connection can be difficult, especially if you need to acquire non-standard, proprietary messages and frames. iTestSystem simplifies this setup by leveraging the NI XNET and CAN drivers to view and configure CAN bus data, import databases, and assign scale factors. iTestSystem then allows users to browse and choose which CAN signals to acquire.
For more information about collecting CAN bus data with an NI 9862 and iTestSystem, or our testing services, contact Chase Petzinger via email at chase.petzinger@itestsystem.com or phone at (844) 837-8797 x704
Related Links
This video shows how to install a strain gauge on a curved surface using M-Bond AE-10 two part epoxy. Watch an ITM test technician walk through each step of the M-Bond AE-10 strain gauge installation procedure.
ITM delivers mobile data acquisition solutions to capture real-time feedback under actual conditions
Whether we are testing a new component on a truck that’s a thousand miles away or putting an off-highway vehicle through its paces right in front of us, it’s our mobile data acquisition products that often lead to ITM’s successes.
How have ITM engineers employed mobile data acquisition to create successful tests and find solutions for their clients? Here are two recent examples:
Example 1: Custom in-vehicle data logging solution captures CAN bus information alongside analog sensor data
The R&D office was filled with our client’s application engineers as they eagerly awaited a first-ever view of their product — a fan drive— as it performed under the hood of a commercial truck more than a thousand miles away.
A display of gauges, needles and dials showed precisely how our client’s product performed during everyday over-the-road stresses. The mobile data acquisition feeds showed fan speed, temperatures around the fan drive, and CAN bus data including engine speed and torque along with coolant, air and oil temperatures. It was an impressive view they had never seen before.
For years this global powertrain technologies company has turned to ITM to gather data for engine-cooling components. Thanks to software innovations at ITM, the firm has taken mobile data acquisition to the next level. Important vehicle information from the CAN (Control Area Network) bus alongside sensor data can be collected and shared real-time, which allows their client to remotely monitor tests as they happen.
“Not only are we correlating information that is broadcast by the vehicle with analog sensor information,” says ITM VP of Operations Ryan Welker, “we can gather data and feed it back to our customer in a way that is configurable to their needs. We can also incorporate GPS technology, which is very valuable. Now they can see if a vehicle is traveling up and down steep hills and see what influence it has on duty cycles of their product.”
To perform the tests, ITM used a RAC-88 data acquisition package that consists of a National Instruments cDAQ chassis and associated hardware as well as an embedded PC that runs ITM’s off-the-shelf iTestSystem DAQ software application. The package is equipped with a broadband router and cellular air cards for remote data connectivity and transmission.
From a pragmatic perspective, Welker points out that the constant monitoring also allows for a far more efficient testing process. Not only do their customers get data quickly (instead of waiting months until a test is complete to begin analysis), but also, any issues that disrupt data collection are brought to light immediately.
Beyond having the ability to build more efficient tests, Welker reiterates the importance of being able to gather more complete data by accessing the vehicle’s CAN bus network.
“This opens the doors to a lot more opportunities for customers that build engines and components,” he says. “Those vehicles are spitting out all kinds of valuable information over the CAN system that we can now correlate with analog signal test data. This allows us to provide customers with a far more accurate picture of exactly what is going on with their equipment.”
Example 2: In-vehicle testing employs mobile data acquisition to assess exhaust system
ITM was challenged with creating a rugged and flexible in-vehicle testing solution to determine the vibration levels of an on-highway vocational vehicle’s exhaust system during operation.
ITM engineers chose the high-performance and rugged NI cDAQ-9139 stand-alone system with NI C Series modules along with our LabVIEW-based data acquisition software, iTestSystem, to create a rugged, high-performance and portable exhaust test system for large vocational vehicles. Our solution provided a wireless interface to the stand-alone NI CompactDAQ system to allow the operator remote control and monitoring of the embedded acquisition and logging system.
“The new stand-alone NI CompactDAQ system provides a high-performance and portable system for demanding in-vehicle testing applications,” says Mark Yeager, ITM engineer and lead programmer. “Our iTestSystem software, based on NI LabVIEW, combined with stand-alone NI CompactDAQ allows us to build flexible mobile data acquisition systems faster than using traditional logging systems.”
ITM has used USB and Ethernet-based NI CompactDAQ systems, and its iTestSystem software, based on NI LabVIEW, for years to build high-performance mobile data acquisition and test systems for our customers in the transportation and in-vehicle space. The stand-alone NI CompactDAQ systems provide a new line of portable and flexible hardware from National Instruments by combining an embedded processor with the modular NI CompactDAQ platform.
Since these new NI cDAQ-913x systems can be used with the same NI LabVIEW system design software, NI DAQmx driver and 50+ existing NI C Series modules, ITM can build new flexible logging solutions for its customers in a very short amount of time.
Designing a Flexible Logging Solution for Exhaust Testing
For this mobile data acquisition application, ITM engineers chose the high-performance and rugged NI cDAQ-9139 stand-alone system with seven NI 9234 accelerometer modules and one NI 9229 module to interface directly to the sensors we leveraged in this application. The standalone cDAQ-9139 was bundled with a cellular network interface and packaged inside a rugged carrying case. For the sensors, ITM mounted 28 piezoelectric accelerometers to the exhaust system and connected them to the seven NI 9234 accelerometer modules. Engineers also installed a magnetic pickup sensor and connected it to the simultaneous, differential NI 9229 analog module to determine rotational speed that would be used later in a post processing order analysis algorithm.
Yeager says they leveraged the Windows Embedded OS running on the NI cDAQ-9139 to make the transition from using NI CompactDAQ USB-based systems connected to a laptop or PC a seamless process. The team used ITM’s iTestSystem software, based on NI LabVIEW system design software, to stream data from staged events and operation directly to the NI cDAQ-9139’s non-volatile hard drive in a TDMS file format. They were able to control and monitor the daq systems remotely via Remote Desktop by connecting the cDAQ-9139 to a Wi-Fi network using a high speed cellular broadband modem and router with Wi-Fi.
After conducting the mobile data acquisition, all of the TDMS data files were transferred to a computer for post processing and analysis. The analysis for this project included calculating the overall vibration levels for each accelerometer using the order analysis plug-in for iTestSystem software that leverages the built-in analysis functions within NI LabVIEW. Additionally, with the iTestSystem software, they were able to provide the customer with a professional report containing overall vibration levels and order analysis graphs that identified which sensor locations failed or met the design criteria.
Leveraging the stand-alone CompactDAQ systems and iTestSystem software for this project was a huge success, and the customer was amazed at how quickly ITM was able to integrate new technologies including both NI and third-party hardware and software. With this system, ITM was also able to reduce the overall cost of their test by reducing the manpower needed to perform the test and providing them with instantaneous feedback of the system functionality by utilizing new technologies.
In the end, the customer liked the mobile data acquisition system so much that instead of sending the system back to ITM, they redeployed it onto another on-highway vehicle to solve a different problem.
Contact Ryan Welker via email at ryan.welker@itestsystem.com for more information about our mobile data acquisition products or iTestSystem.
Obvious signs of fatigue — cracks at the corners of doors — had begun to surface on an in-service Railcar. A railcar structural testing case study.
Check out this video of a Lego Test Cell Model that is controlled with an NI CompactRIO. ITM implemented an embedded vibration health monitoring application at an engine manufacturing company in Texas. The distributed system monitored and reported damaging engine dyno vibration levels on 10 engine test cells.
Finding efficiency improvements and uncovering hidden unsafe conditions in a process can prevent injury and save your company millions.
ITM provides software development, structural and mechanical testing services, industrial monitoring, strain gauging, and data analysis solutions to clients on six continents. ITM is a recognized National Instruments Gold Alliance Partner.
![]()