Another Successful Condition Monitoring System Installation

Last week our team successfully and safely installed another Boiler Monitoring System (BMS). This system, a Sootblower Fouling Detection (SFD) system, monitors structural and vibration sensors that quantify the boiler’s response to sootblower operations. The SFD system analyzes the boiler response data and outputs Key Performance Indicators (KPIs) such as fouling level, sootblower efficiency, and sootblower health to automated boiler cleaning systems.
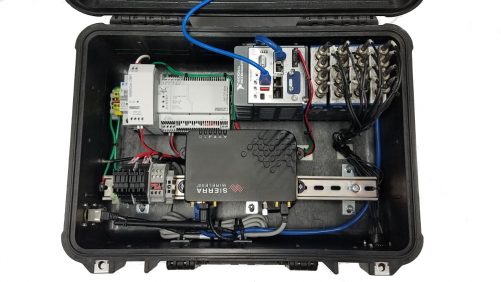
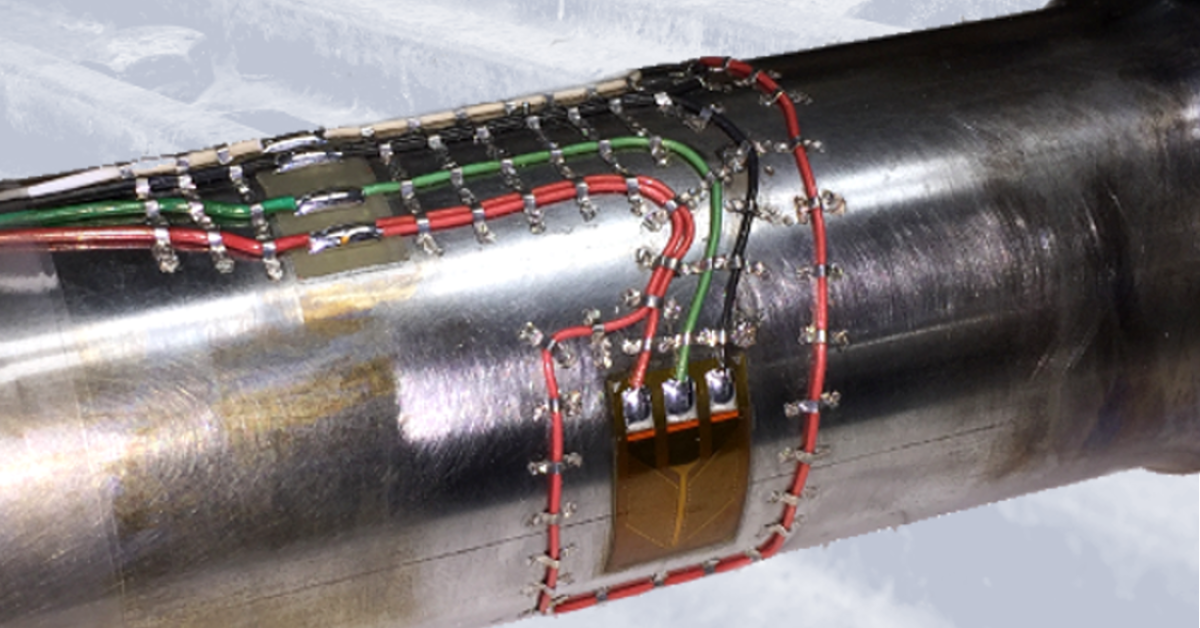
This boiler uses over 50 sootblowers located at different elevations to clean soot build-up from boiler steam tubes. Since the vibration measurement locations are relatively far apart, the SFD system requires a distributed monitoring system consisting of several junction boxes that monitor and process data for groups of sensors. One team of engineers mounted the vibration sensors to the sootblowers and confirmed communication back to a local junction box containing the National Instruments condition monitoring hardware. The other team installed the junction box panels and terminated the sensor cables.
After all the sensor installations and terminations were completed, each sensor’s location and calibration were verified. While the sensor verification was being completed, one engineer worked with the mill IT department and the controls engineer to establish remote connection to the system and confirm communication with the mill’s automated cleaning system.
After commissioning the system and returning to our home base, our engineers are now monitoring the system through a VPN connection and assisting boiler operators with optimizing their cleaning process.
For more information about our ryan.welker@iTestSystem.com or phone @ 1.844.837.8797 x702