Check out this video showing one of our custom rugged data acquisition systems! We provide custom systems like this for aerospace, vehicle, off-highway, and civil applications. This system shown in this video was designed for collecting strain, vibration, and other sensors on a civil structure.
https://itestsystem.com/wp-content/uploads/2020/09/CustomSystems.png6281200Mark Yeagerhttps://itestsystem.com/wp-content/uploads/2020/05/itmlogo_Horizontal_3x1.pngMark Yeager2020-08-17 11:00:002023-07-28 23:56:17Video: Custom Rugged Data Acquisition Systems
A case study describing a strain gauge DAQ system used to validate several new designs of a heavy lift lattice boom crane to comply with SAE J987 standards.
At ITM, we understand that our customers do not settle for good enough. When it comes to measuring and capturing data for real-world applications and structural analysis, you cannot compromise, so neither can we. Instead of having to pick and choose the most critical locations to measure, we ensure that you can capture every piece of data you need, simultaneously. Whether that is a single strain bridge, or thousands of strain channels, we make your data logging project a success.
On past projects, we have worked with our customers in the manufacturing industry to test the structures of their aerospace, mining, construction and other transportation equipment. Some of these applications not only needed to collect strain, vibration, voltage, and other signals simultaneously but also required well over a thousand total sensor channels. Network synchronization technology embedded within the NI cDAQ chassis allow users to account for the sheer number of channels during these structural tests. The true secret to our success in these high-channel jobs has been our iTestSystem software which leverages the cDAQ’s synchronization technology while providing an intuitive data acquisition and sensor configuration and setup.
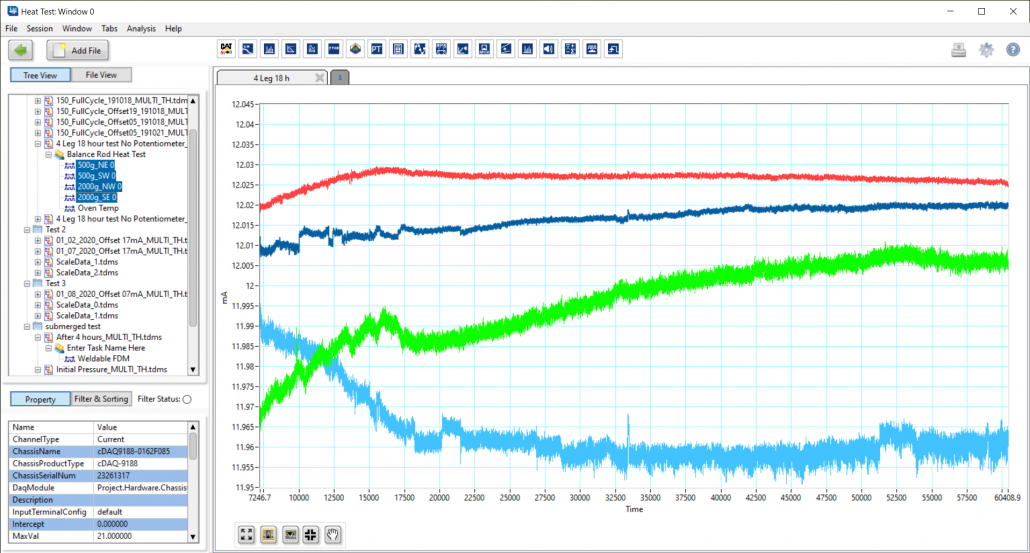
iTestSystem is far more than just a barebones data collection software. It can be a time saver to our engineers by helping to sort channels, keep various tasks organized, and even provide an easy and quick way to view results with the integrated TestView Plus Application (shown below).
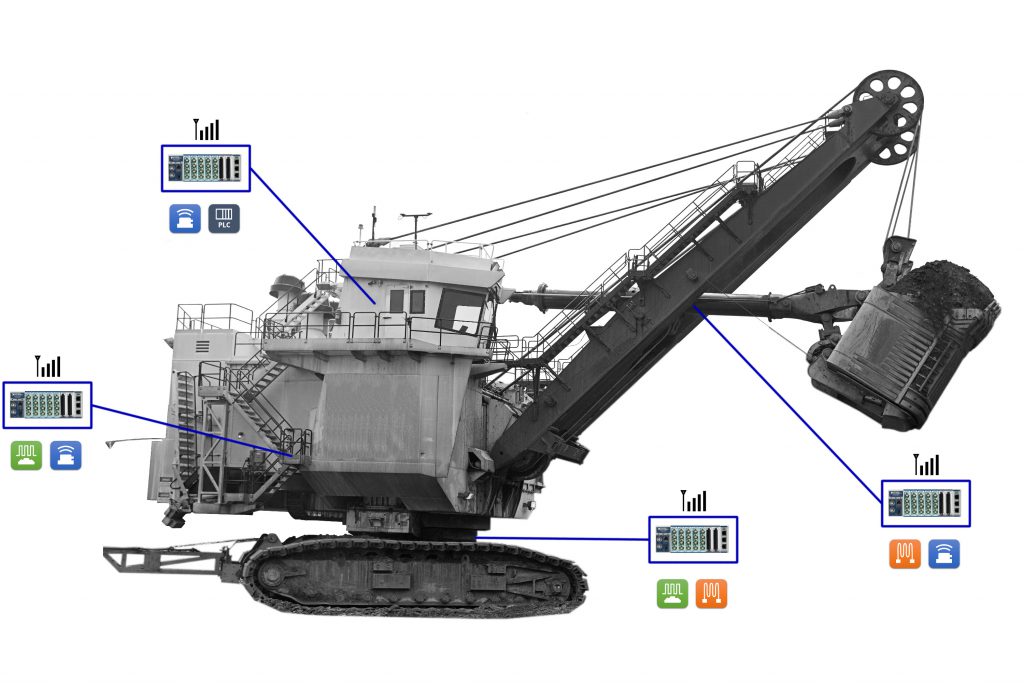
The mining shovel pictured below, which is similar to other equipment that ITM has instrumented in the past, illustrates a distributed data acquisition system for collecting data. Using iTestSystem, we can implement a modified tree synchronization topology to collect data from over 20+ cDAQ chassis simultaneously. Data can be collected in one giant file containing all sensor channels or saved into separate files based on location. In past projects, we saved over 1000 channels from strain, acceleration, and voltage sensors into a new file every 10 minutes. We added the sensor location to the sensor description, including the Boom, Operator Cab, Main Frame and Base. This allowed us to easily sort data both during and after the collection.
Our goal at Integrated Test & Measurement is to provide efficient testing solutions and services to address your company’s needs. If you need to measure high channel counts, or have questions about our rugged DAQ systems, software, rental equipment or testing services, then please contact ITM by phone or e-mail.
Contact Information: For more information on this Article, please visit iTestSystem.com or contact: Ryan Welker – Integrated Test & Measurement (ITM), LLC – ryan.welker@itestsystem.com or (844) 837-8797
https://itestsystem.com/wp-content/uploads/2020/07/Rope-Shovel.png6281200Ryan Welkerhttps://itestsystem.com/wp-content/uploads/2020/05/itmlogo_Horizontal_3x1.pngRyan Welker2020-07-23 10:00:002023-07-29 01:23:46High Channel Count Structural DAQ Systems
https://itestsystem.com/wp-content/uploads/2020/07/IndustrialProcess.jpg6281200Mark Yeagerhttps://itestsystem.com/wp-content/uploads/2020/05/itmlogo_Horizontal_3x1.pngMark Yeager2020-07-08 10:00:002023-07-26 18:06:27Process Optimization with Embedded Monitoring Systems
When streaming high speed data over a long period of time it is important to estimate data file size to avoid filling up your drive and also to prevent producing large, unwieldy data files. I usually try to keep file sizes less than one (1) gigabyte (FAT 32 maximum file size is 4 gigabytes) to minimize potential data losses and to make sure data transfers, analysis, and plotting don’t take too long. Whether you are using the free version of iTestSystem to manually control data file size or the paid version to automatically control file size, it is important to estimate your file size before collecting data.
iTestSystem uses the standard binary TDMS file format to stream high speed data to disk. Estimating file size depends on five (5) things.
Header Size (Negligible for large files)
Number of Channels
Data Type Size in Bytes
Sample Rate
Logging Duration
File Size Formula = ((Number of Channels) x (Data Type Size (bytes)) x (Sample Rate (Samples/Second)) x (Logging Duration (Seconds))) + Header Size
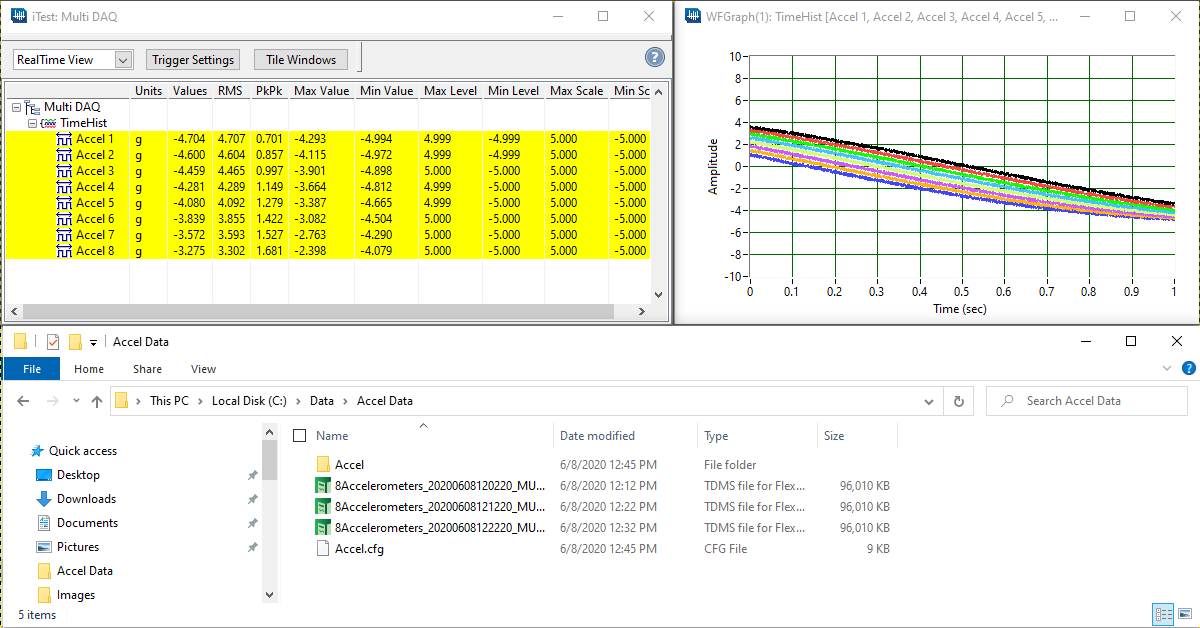
File Size Example: Eight (8) Accelerometer Channels sampled at 2560 Samples/Second are logged as a double (8 Bytes) for 600 seconds to a TDMS data file. Estimated file size = (8 x 8 x 2560 x 600) = 98,304,000 bytes or 96,000 KB (98,304,000 bytes/1024 bytes / KB).
Our test engineers are often called upon to deploy unattended or “black box” data acquisition systems in the field. These systems are deployed on machinery, vehicles, and industrial processes to constantly record strain and vibration data at sample rates between 100 and 100,000 Hz. That adds up to a lot of data to sift through.
In situations where we are trying to identify system operation outliers or damaging events, we utilize the Automated Analytics application in iTestSystem to limit the amount of data searches required. The Automated Analytics application allows users to analyze, build, and send sensor level reports only when specific vibration and strain limits are exceeded. Instead of searching through data files, engineers can easily review the report and download relevant data files from deployed systems for further analysis.
This video demonstrates how to build and send vibration and strain reports using Automated Analytics and other iTestSystem tools and applications.
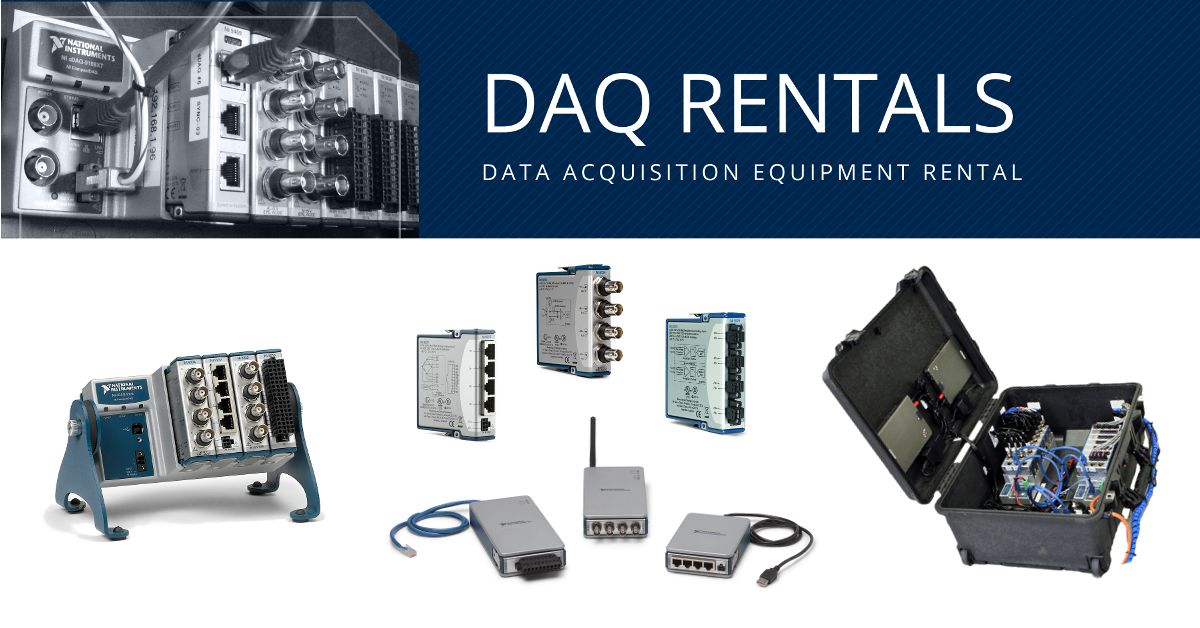
Do you need software and National Instruments (NI) C-Series hardware to fulfill your testing requirements? During this uncertain time, Integrated Test & Measurement (ITM) is here to support you. We offer various C-Series voltage, strain, vibration, and temperature modules for rent that can be easily configured in our iTestSystem software for you to record and collect data. The rental hardware can be packaged in a ruggedized case for harsh environments. Also, the rental hardware can be set up for unattended testing applications.
For more information about eligibility, equipment availability or to request a quote contact josh.fishback@itestsystem.com
Click Here for more information about equipment rental.
Click Here for more information about our iTestSystem software.
Precision testing generates precision data. Acquiring, accessing, and analyzing these data files allows engineers and scientists to lower product costs, engineer time-saving solutions, and even save lives. National Instruments (NI) created the Technical Data Management Streaming (TDMS) file format for high performance data streaming and retrieval. This binary file is structured for easier sorting and access of the complex data within the file.
Collect TDMS files with iTestSystem
Are you looking for expert assistance understanding and manipulating TDMS data files? ITM has greatly simplified things with iTestSystem, its free custom engineering software platform that enables you to organize, acquire, view and analyze data.
Allow our experts to walk you through TDMS files or point you to our free solutions.
Before NI standardized on the TDMS data file engineers and scientists had to create their own high-performance file types. The TDMS file format is supported not only by iTestSystem, but also across all NI software.
WHAT HAPPENS WHEN YOU WANT TO SHARE THESE FILES WITH COLLEAGUES WHEN THEY DO NOT HAVE ITESTSYSTEM INSTALLED ON THEIR COMPUTERS?
In these instances, it is often easiest to export a TDMS file to a more commonly used file type like Microsoft Excel (XLSX).
NI provides a free program / plug-in that allows users to open TDMS files in Microsoft Excel. This means anyone can convert a TDMS file into an XLSX file and open it in Excel, and once there the file can be easily saved just like any other spreadsheet. Once saved as an Excel file, you can share, open, view and edit it just like any other XLSX file.
HOW DO I GET THE TDMS IMPORTER PROGRAM / PLUG-IN FOR MICROSOFT EXCEL?
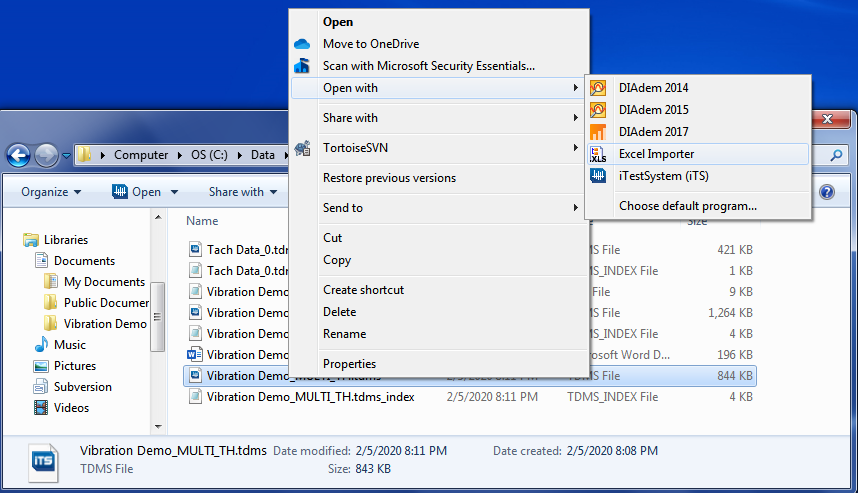
Once you have downloaded the NITDMExcel program by following the link and using the built-in installation wizard, you can save TDMS files as XLSX Excel files. To open a TDMS file in Excel, you can simply double-click the TDMS file. If that doesn’t work, you will need to right-click, navigate to “Open With”, and find the NITDMExcel program wherever you installed it on your computer.
Right click on TDMS file to import file into Excel
Figure1: Right click on a TDMS file to import into Excel.
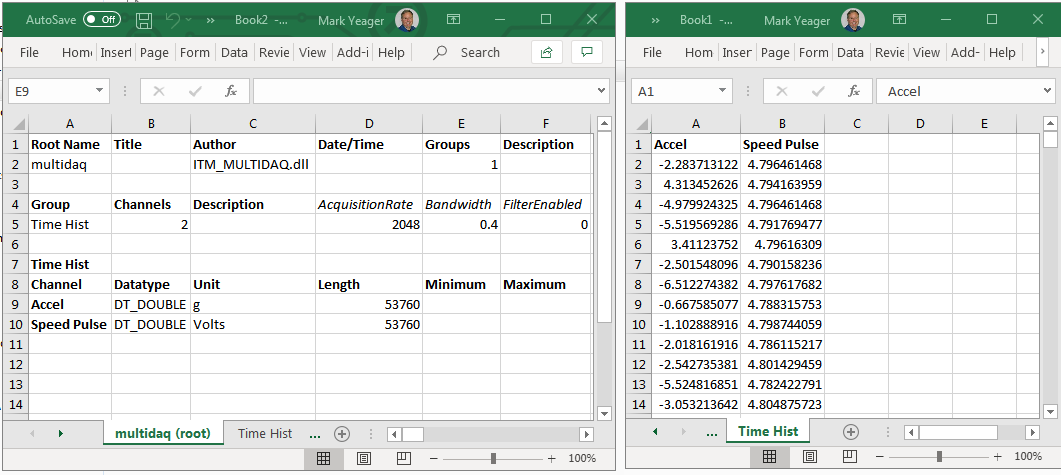
Each time you open a TDMS file in Excel, it will create a new workbook. Each workbook will have multiple sheets, one for the file properties such as the name of the test, date the data was taken, and more. The other sheet(s) will contain the data points plotted as part of the test, which would normally be used to create graphs in TestView Plus.
Now you can save the Excel and share it just like any other XLS file!
Choosing an accelerometer for rotating machinery vibration measurements can be a daunting task since there are so many options available. This blog outlines the characteristics you should consider when choosing a piezoelectric single axis accelerometer for general purpose vibration measurements and presents some accelerometers to consider.
Characteristics of a General Purpose Accelerometer
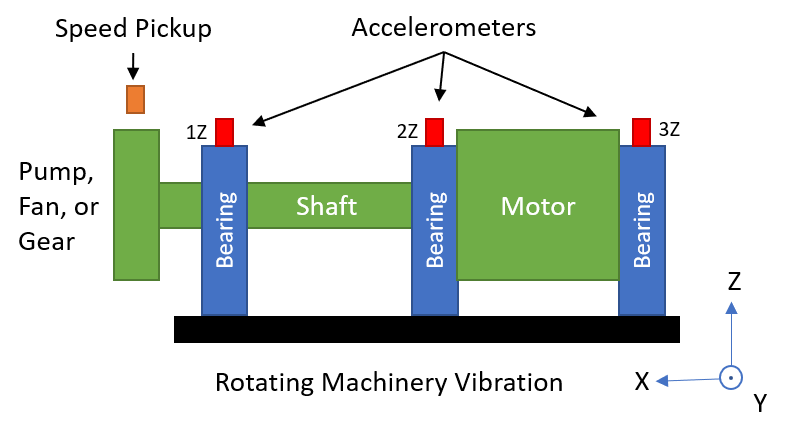
When measuring vibration on rotating equipment such as motors, pumps, and generators, the most common measurement location(s) are on the shaft bearing housing(s) at the shaft centerline. At this location, typical vibration levels perpendicular to the shaft are < 100 g and the frequency range of interest is < 5000 Hz. A general purpose single axis piezoelectric accelerometer with either a 10 mV/g or 100 mV/g sensitivity fits this criteria.
Other characteristics to consider are size, mounting options, cable connections, grounding, and cost. Several mounting options are available. They include magnetic bases, adhesive bases and stud mounts. The mounting option you choose affects the frequency range of your accelerometer measurements. The table below shows typical frequency limits for accelerometer mounting methods.
Mount Type
Typical Frequency Limit
Magnet
2,000 Hz
Adhesive
5,000 Hz
Stud
6,000 Hz
5 General Purpose Accelerometers
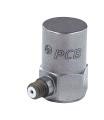
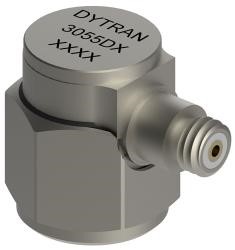
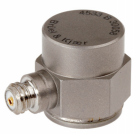
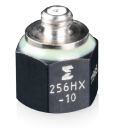
The table below shows some examples of stud mounted general purpose piezoelectric accelerometers. These accelerometers all have a female 10-32 coaxial / microdot connector. It is important to note that this is not a complete list of accelerometers and there are many options available from each manufacturer. I would encourage you to go to the websites linked in the table and see what’s available.
We use cookies to ensure that we give you the best experience on our website. If you continue to use this site we will assume that you are happy with it.