Vehicle Component Testing
…more than a thousand miles away. A display of gauges, needles and dials showed precisely how their product performed during every day over-the-road stress.

The Construction | Mining category contains case studies and blogs related to ITM’s engineering and testing services for the mining and construction industry.
…more than a thousand miles away. A display of gauges, needles and dials showed precisely how their product performed during every day over-the-road stress.
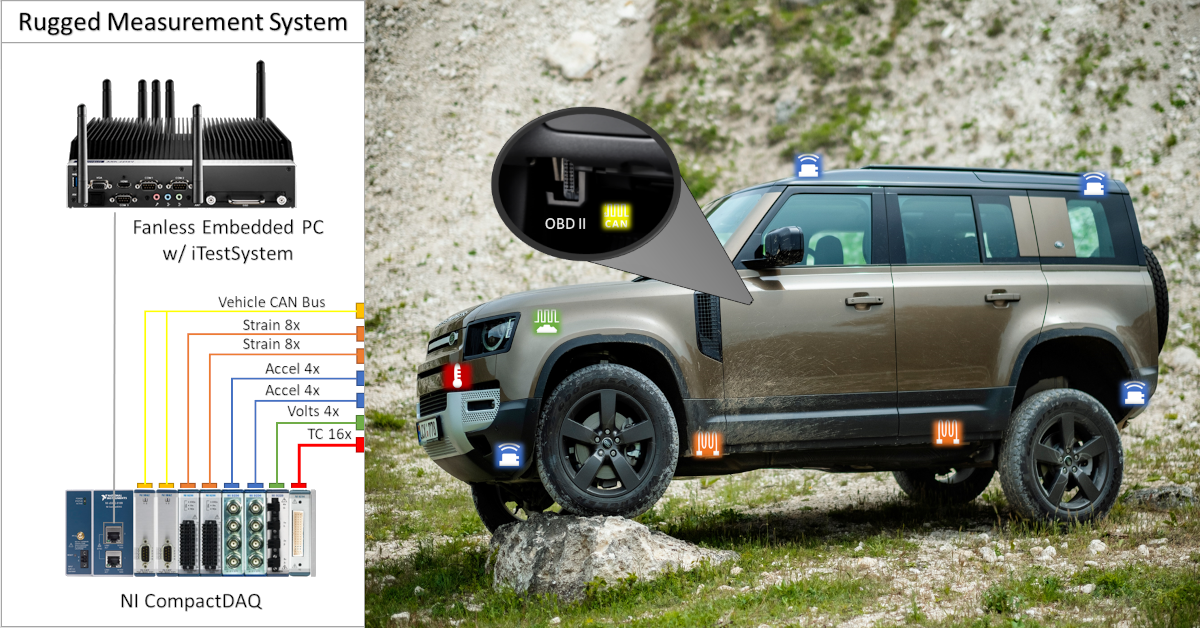
Automotive and off-highway engineers and designers often need to log vehicle bus data along with vibration, strain gauge, and other sensor data during normal operation to evaluate their design. Using data from all these sources enables these engineers and designers to pinpoint a vehicle’s response to staged or damaging events. For example, engineers can see how steering wheel position and speed effect structural response when the vehicle hits a pothole.
How does steering wheel position and speed effect structural response when the vehicle hits a pothole?
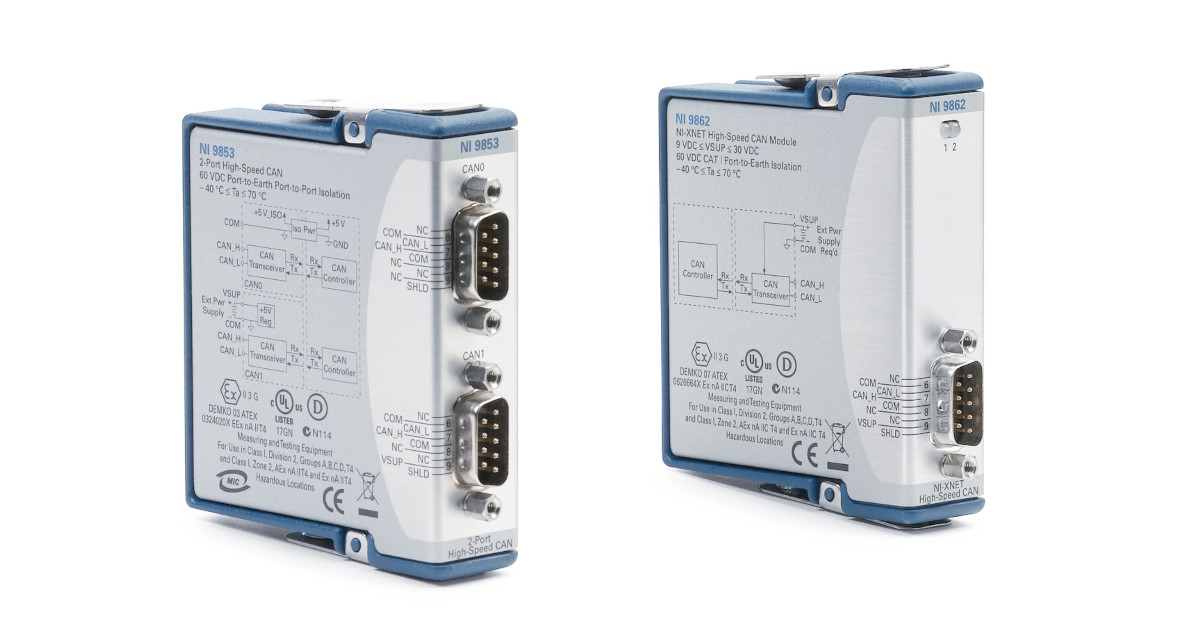
In situations where our engineers need to tap into the vehicle’s on-board diagnostics using CAN bus data and analog sensor data to identify and solve a problem, we will deploy a rugged measurement solution based on NI CompactDAQ (cDAQ) hardware. These systems usually include an industrial compact pc or standalone cDAQ running the iTestSystem engineering measurement application. iTestSystem logs data from the vehicle bus connected to NI 9862 CAN module and other analog sensors connected to NI cDAQ modules like NI 9234, NI 9236, and NI 9229 into one data file.
NI 9862 CAN Module Specifications and Connections
According to the NI data sheet, the NI 9862 modules is a single CAN port device that is isolated from the other modules in the system. The port has a Bosch DCAN CAN controller that is CAN 2.0B-compatible and fully supports both 11-bit and 29-bit identifiers. The port also has an NXP TJA1041AT High-Speed CAN transceiver that is fully compatible with the ISO 11898 standard and supports baud rates up to 1 Mbps. This module requires +9 to +30 VDC supply voltage to operate.
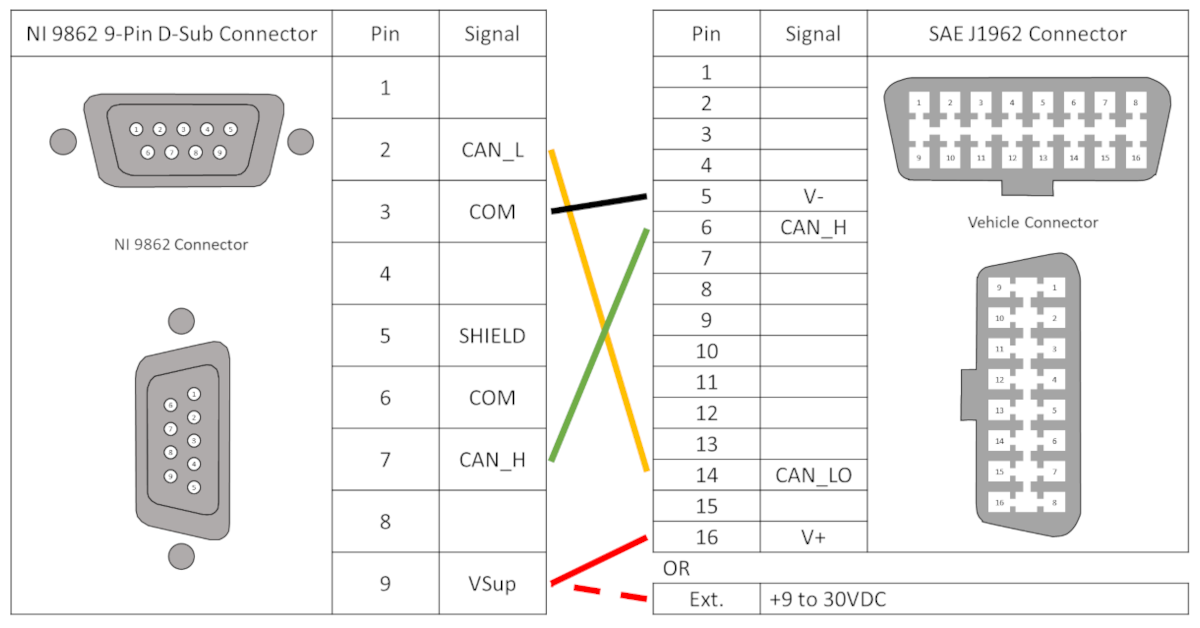
The table below shows the connections between the NI 9862 9 pin D-Sub and the SAE J1962 connector that are required for CAN communication. NI sells a OBDII9M-DB9F CAN Cable cable if you don’t want make your own cable.
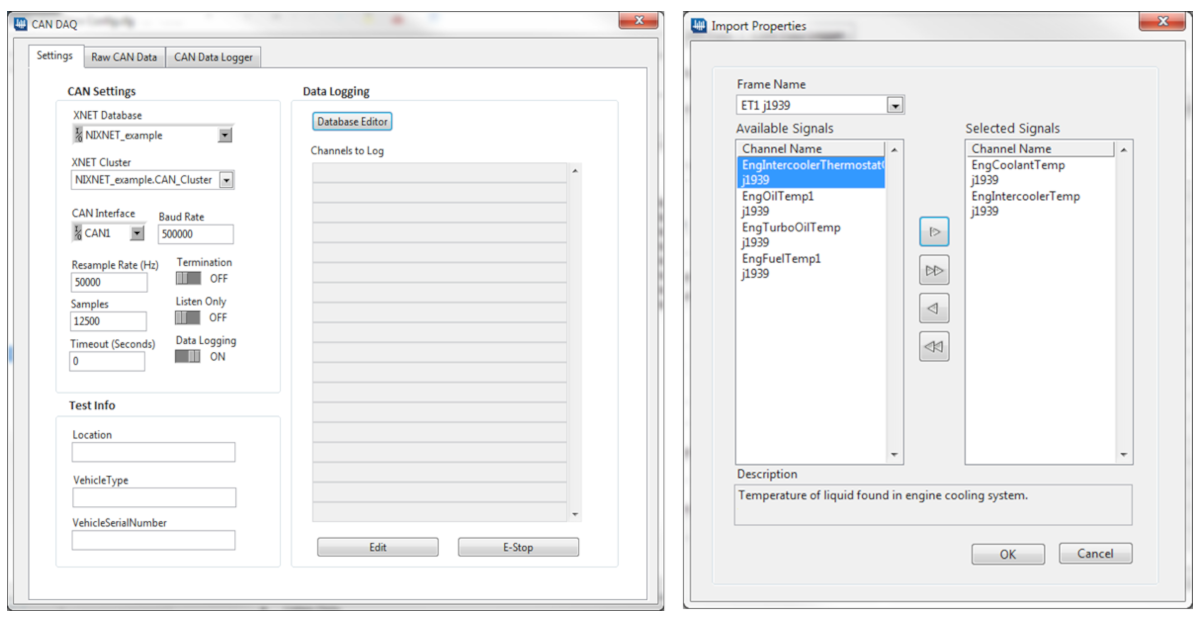
iTestSystem CAN Channel Setup
Setting up a vehicle CAN bus connection can be difficult, especially if you need to acquire non-standard, proprietary messages and frames. iTestSystem simplifies this setup by leveraging the NI XNET and CAN drivers to view and configure CAN bus data, import databases, and assign scale factors. iTestSystem then allows users to browse and choose which CAN signals to acquire.
For more information about collecting CAN bus data with an NI 9862 and iTestSystem, or our testing services, contact Chase Petzinger via email at chase.petzinger@itestsystem.com or phone at (844) 837-8797 x704
Related Links

Suspended in a harness 30 feet above a concrete spillway in central North Dakota, ITM engineer Ryan “RJ” Matthews instruments the gate of one of the world’s largest earthen dams with dozens of strain gauge sensors.
Integrated Test & Measurement’s field service technicians and engineers have installed strain gauges on civil structures and machinery around the globe for decades, and this project represents one more example of rugged data acquisition. In this instance, the team rappelled from an overhead abutment on the Garrison Dam — a 2-mile-long structure along the Missouri River built by the Army Corp. of Engineers starting in 1947.
Contracted by Cotech IRM Services, ITM was charged with collecting data to measure the strain on one of the 28 spillway gates which are designed to raise and close to allow water to pass from the reservoir during rare flood events. Just behind those gates is Lake Sakakawea, one of the largest man-made lakes in the United States.

Despite the complex location, Matthews and co-worker Zach Strong were able to successfully instrument the spillway gate with 44 single-axis strain gauges and solder signal cables which lead back to a NI CompactDAQ system connected to their laptop, allowing them to successfully gather streams of crucial data using iTestSystem while the gate was put through its paces.
The project is yet another example of ITM’s ability to combine the use of strain gauge sensors, a cDAQ system and the firm’s iTestSystem software to create a structural health monitoring system. In this instance, the project required only one-time testing, but ITM can also establish a permanent structural health monitoring system as well. iTestSystem is an engineering measurement software platform that enables test engineers to organize, acquire, view, and analyze data from machinery, processes, vehicles and other complex systems. iTestSystem was specifically designed for use with National Instruments (NI) cDAQ hardware for data collection and data logging.
For Matthews, it was his first experience installing strain gauges while strapped into a bosun’s chair and dangling in midair, but he points out that ITM’s strain gauge process is essentially the same whether their engineers are standing on a bridge or inside a railcar. All that changes is the method of access and environment.
His field notes reveal that each strain gauge on this job was wired in a quarter bridge configuration, which provides one individual measurement of strain (positive tension or negative compression) per location. All gauges were adhered to the gate using M-bond 200 epoxy. A final report submitted to the customer contained detailed instrumentation and test notes and results reported in a series of stress/strain tables and stress graphs.
Contact ITM for your Strain Gauge Needs
Installing strain gauges in the field for structural and fatigue measurements requires expertise and experience. Whether you use our iTestSystem software to stream and analyze strain signals for static measurements and real-world fatigue data acquisition or contract our software engineers to build a real time strain monitoring system, we will make sure you acquire quality strain data. Contact our strain lab and technicians to install strain gauges on test specimens or to design, build, calibrate, and test strain-based load cells.
Strain Lab Contact Info: Ryan.Welker@iTestSystem.com, (844) 837-8797
This video shows how to install a strain gauge on a curved surface using M-Bond AE-10 two part epoxy. Watch an ITM test technician walk through each step of the M-Bond AE-10 strain gauge installation procedure.
ITM delivers mobile data acquisition solutions to capture real-time feedback under actual conditions
Whether we are testing a new component on a truck that’s a thousand miles away or putting an off-highway vehicle through its paces right in front of us, it’s our mobile data acquisition products that often lead to ITM’s successes.
How have ITM engineers employed mobile data acquisition to create successful tests and find solutions for their clients? Here are two recent examples:
Example 1: Custom in-vehicle data logging solution captures CAN bus information alongside analog sensor data
The R&D office was filled with our client’s application engineers as they eagerly awaited a first-ever view of their product — a fan drive— as it performed under the hood of a commercial truck more than a thousand miles away.
A display of gauges, needles and dials showed precisely how our client’s product performed during everyday over-the-road stresses. The mobile data acquisition feeds showed fan speed, temperatures around the fan drive, and CAN bus data including engine speed and torque along with coolant, air and oil temperatures. It was an impressive view they had never seen before.
For years this global powertrain technologies company has turned to ITM to gather data for engine-cooling components. Thanks to software innovations at ITM, the firm has taken mobile data acquisition to the next level. Important vehicle information from the CAN (Control Area Network) bus alongside sensor data can be collected and shared real-time, which allows their client to remotely monitor tests as they happen.
“Not only are we correlating information that is broadcast by the vehicle with analog sensor information,” says ITM VP of Operations Ryan Welker, “we can gather data and feed it back to our customer in a way that is configurable to their needs. We can also incorporate GPS technology, which is very valuable. Now they can see if a vehicle is traveling up and down steep hills and see what influence it has on duty cycles of their product.”
To perform the tests, ITM used a RAC-88 data acquisition package that consists of a National Instruments cDAQ chassis and associated hardware as well as an embedded PC that runs ITM’s off-the-shelf iTestSystem DAQ software application. The package is equipped with a broadband router and cellular air cards for remote data connectivity and transmission.
From a pragmatic perspective, Welker points out that the constant monitoring also allows for a far more efficient testing process. Not only do their customers get data quickly (instead of waiting months until a test is complete to begin analysis), but also, any issues that disrupt data collection are brought to light immediately.
Beyond having the ability to build more efficient tests, Welker reiterates the importance of being able to gather more complete data by accessing the vehicle’s CAN bus network.
“This opens the doors to a lot more opportunities for customers that build engines and components,” he says. “Those vehicles are spitting out all kinds of valuable information over the CAN system that we can now correlate with analog signal test data. This allows us to provide customers with a far more accurate picture of exactly what is going on with their equipment.”
Example 2: In-vehicle testing employs mobile data acquisition to assess exhaust system
ITM was challenged with creating a rugged and flexible in-vehicle testing solution to determine the vibration levels of an on-highway vocational vehicle’s exhaust system during operation.
ITM engineers chose the high-performance and rugged NI cDAQ-9139 stand-alone system with NI C Series modules along with our LabVIEW-based data acquisition software, iTestSystem, to create a rugged, high-performance and portable exhaust test system for large vocational vehicles. Our solution provided a wireless interface to the stand-alone NI CompactDAQ system to allow the operator remote control and monitoring of the embedded acquisition and logging system.
“The new stand-alone NI CompactDAQ system provides a high-performance and portable system for demanding in-vehicle testing applications,” says Mark Yeager, ITM engineer and lead programmer. “Our iTestSystem software, based on NI LabVIEW, combined with stand-alone NI CompactDAQ allows us to build flexible mobile data acquisition systems faster than using traditional logging systems.”
ITM has used USB and Ethernet-based NI CompactDAQ systems, and its iTestSystem software, based on NI LabVIEW, for years to build high-performance mobile data acquisition and test systems for our customers in the transportation and in-vehicle space. The stand-alone NI CompactDAQ systems provide a new line of portable and flexible hardware from National Instruments by combining an embedded processor with the modular NI CompactDAQ platform.
Since these new NI cDAQ-913x systems can be used with the same NI LabVIEW system design software, NI DAQmx driver and 50+ existing NI C Series modules, ITM can build new flexible logging solutions for its customers in a very short amount of time.
Designing a Flexible Logging Solution for Exhaust Testing
For this mobile data acquisition application, ITM engineers chose the high-performance and rugged NI cDAQ-9139 stand-alone system with seven NI 9234 accelerometer modules and one NI 9229 module to interface directly to the sensors we leveraged in this application. The standalone cDAQ-9139 was bundled with a cellular network interface and packaged inside a rugged carrying case. For the sensors, ITM mounted 28 piezoelectric accelerometers to the exhaust system and connected them to the seven NI 9234 accelerometer modules. Engineers also installed a magnetic pickup sensor and connected it to the simultaneous, differential NI 9229 analog module to determine rotational speed that would be used later in a post processing order analysis algorithm.
Yeager says they leveraged the Windows Embedded OS running on the NI cDAQ-9139 to make the transition from using NI CompactDAQ USB-based systems connected to a laptop or PC a seamless process. The team used ITM’s iTestSystem software, based on NI LabVIEW system design software, to stream data from staged events and operation directly to the NI cDAQ-9139’s non-volatile hard drive in a TDMS file format. They were able to control and monitor the daq systems remotely via Remote Desktop by connecting the cDAQ-9139 to a Wi-Fi network using a high speed cellular broadband modem and router with Wi-Fi.
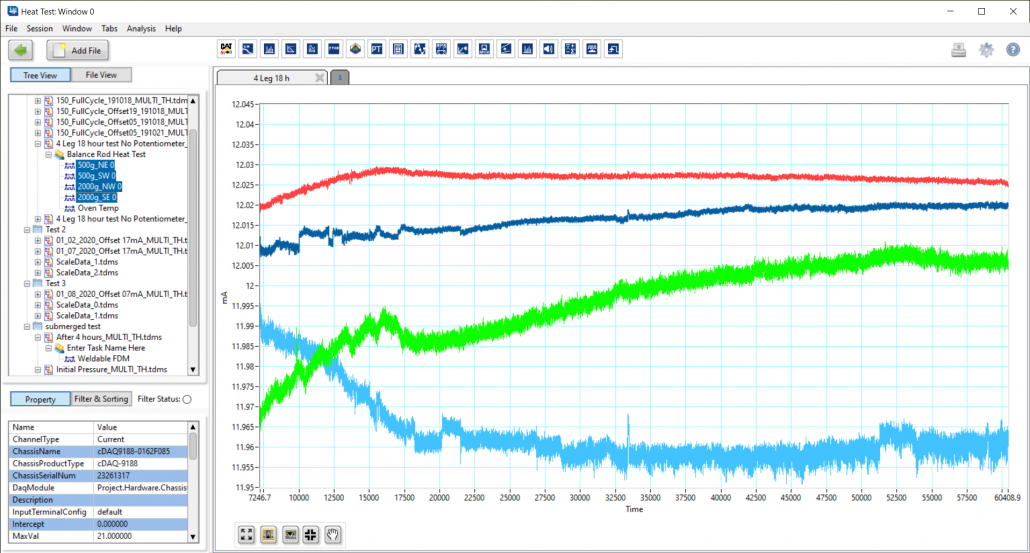
After conducting the mobile data acquisition, all of the TDMS data files were transferred to a computer for post processing and analysis. The analysis for this project included calculating the overall vibration levels for each accelerometer using the order analysis plug-in for iTestSystem software that leverages the built-in analysis functions within NI LabVIEW. Additionally, with the iTestSystem software, they were able to provide the customer with a professional report containing overall vibration levels and order analysis graphs that identified which sensor locations failed or met the design criteria.
Leveraging the stand-alone CompactDAQ systems and iTestSystem software for this project was a huge success, and the customer was amazed at how quickly ITM was able to integrate new technologies including both NI and third-party hardware and software. With this system, ITM was also able to reduce the overall cost of their test by reducing the manpower needed to perform the test and providing them with instantaneous feedback of the system functionality by utilizing new technologies.
In the end, the customer liked the mobile data acquisition system so much that instead of sending the system back to ITM, they redeployed it onto another on-highway vehicle to solve a different problem.
Contact Ryan Welker via email at ryan.welker@itestsystem.com for more information about our mobile data acquisition products or iTestSystem.

Whether manufacturing vehicles, mining natural resources or operating machinery on a construction site, a single common factor can bring your operation and productivity to an absolute halt.
That factor is noise.
In a world where precision and performance rule, measuring and controlling sound levels can be crucial to the success of your product or project. The team at Integrated Test & Measurement (ITM) have developed a customized solution that not only measures and collects sound-level data, but will help your team identify the specific components causing all that noise.
On-Site Sound Testing Capabilities
ITM can assist with all types of sound testing on site including:
In each of these instances, their engineers will be packing a custom Sound Level Test Kit full of data acquisition hardware, microphones and more. The key to their equipment, however, is that each kit includes ITM’s proprietary iTestSystem software, an intuitive sound-level human machine interface (HMI) that allows for sound-level recording and reporting.
Mark Yeager, ITM Lead Programmer, says building the capability within iTestSystem to measure microphone data now allows customers to look at a real-time display of sound-level measurements.
Yeager says their crew can build out tests on site to do such things as measure pass-by noise, a process by which the team arranges mics inside a vehicle and along both sides of a 40-yard stretch then capture, monitor and analyze a vehicle’s sound and compare it to acceptable standards. By breaking apart the frequencies of components, they can even zero in on trouble spots such as a turbocharger on a car or a loud cooling fan on a piece of construction equipment.
Measuring Dangerous Sound
Yeager also points out the need to measure sound in places like construction sites or mines, where there may be concern over hearing loss for operators. According to the Centers for Disease Control, hearing loss can result from a single loud sound (like firecrackers) near your ear. Or, more often, hearing loss can result over time from damage caused by repeated exposures to loud sounds. The louder the sound, the shorter the amount of time it takes for hearing loss to occur. Sound is measured in decibels (dB). A whisper is about 30 dB, normal conversation is about 60 dB, and a motorcycle engine running is about 95 dB. The CDC advises that noise above 70 dB over a prolonged period of time may start to damage your hearing, and loud noise above 120 dB can cause immediate harm to your ears.
Test-Ready Sound Level Kits
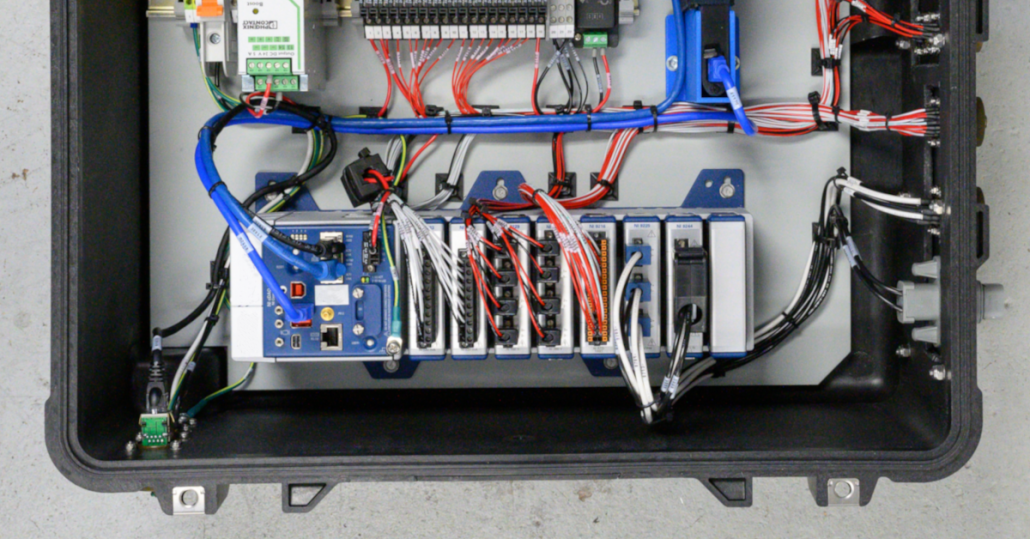
If you have test engineers on-site and simply need the equipment to help you get to the bottom of your sound issues, ITM will ship their test-ready kit that includes a pair of pelican carrying cases packed with the following components:
Whether your needs include on-site sound testing and analysis or you simply need the crucial equipment to measure sound and vibration levels yourself, ITM can help.
ITM is a structural test & measurement engineering service and software company located in Milford, Ohio, that helps companies reduce costs and improve efficiencies in their product development, manufacturing, and production activities. ITM is a recognized NI Gold Alliance Partner that provides software development, structural and mechanical testing services, industrial monitoring, strain gauging, and data analysis solutions to clients around the globe.
For more information about sound and noise level testing or our sound level test system or other data collection solutions, contact Ryan Welker via email at ryan.welker@itestsystem.com or phone at (844) 837-8797 x702.
A case study describing a strain gauge DAQ system used to validate several new designs of a heavy lift lattice boom crane to comply with SAE J987 standards.
At ITM, we understand that our customers do not settle for good enough. When it comes to measuring and capturing data for real-world applications and structural analysis, you cannot compromise, so neither can we. Instead of having to pick and choose the most critical locations to measure, we ensure that you can capture every piece of data you need, simultaneously. Whether that is a single strain bridge, or thousands of strain channels, we make your data logging project a success.
On past projects, we have worked with our customers in the manufacturing industry to test the structures of their aerospace, mining, construction and other transportation equipment. Some of these applications not only needed to collect strain, vibration, voltage, and other signals simultaneously but also required well over a thousand total sensor channels. Network synchronization technology embedded within the NI cDAQ chassis allow users to account for the sheer number of channels during these structural tests. The true secret to our success in these high-channel jobs has been our iTestSystem software which leverages the cDAQ’s synchronization technology while providing an intuitive data acquisition and sensor configuration and setup.
iTestSystem is far more than just a barebones data collection software. It can be a time saver to our engineers by helping to sort channels, keep various tasks organized, and even provide an easy and quick way to view results with the integrated TestView Plus Application (shown below).
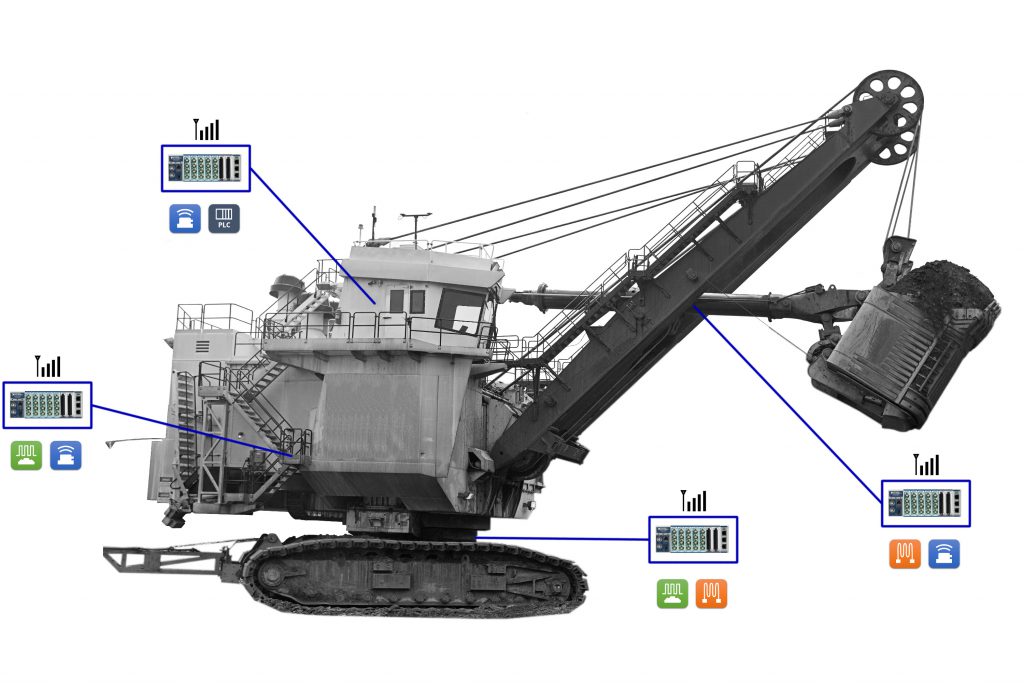
The mining shovel pictured below, which is similar to other equipment that ITM has instrumented in the past, illustrates a distributed data acquisition system for collecting data. Using iTestSystem, we can implement a modified tree synchronization topology to collect data from over 20+ cDAQ chassis simultaneously. Data can be collected in one giant file containing all sensor channels or saved into separate files based on location. In past projects, we saved over 1000 channels from strain, acceleration, and voltage sensors into a new file every 10 minutes. We added the sensor location to the sensor description, including the Boom, Operator Cab, Main Frame and Base. This allowed us to easily sort data both during and after the collection.
Our goal at Integrated Test & Measurement is to provide efficient testing solutions and services to address your company’s needs. If you need to measure high channel counts, or have questions about our rugged DAQ systems, software, rental equipment or testing services, then please contact ITM by phone or e-mail.
Contact Information: For more information on this Article, please visit iTestSystem.com or contact: Ryan Welker – Integrated Test & Measurement (ITM), LLC – ryan.welker@itestsystem.com or (844) 837-8797

If the COVID-19 pandemic has proven anything, it is that we live in a business climate where efficiency and accuracy have never been more important. In other words, none of us can afford to make costly mistakes.
With that in mind, I’d like to share some tips for you to consider when it comes to this important question: How Do You Estimate Test Engineering Services Costs?
For engineers, testing engineers and managers who find themselves estimating jobs, getting this step right will prove crucial not only to the success of your projects and bottom line, but also to the trust you build with your clients.
The most important requirement is to properly define the project scope of work. This will not only help you determine the necessary hardware, software, and resources required, but it will also help you identify the customer’s expectations and project deliverables. Properly defining the scope of work will help eliminate or minimize overall project time, as it will prevent delays both during the preparation phase and testing phases. Defining the scope of work will require a deep-dive discussion with your client to fully understand their challenges and goals. Remember not to leave vague language in your proposals. In other words, be sure to define who is responsible to provide all that will be needed to fulfill the project. Without a clear definition of the requirements and deliverables, it leaves a lot open for misinterpretation and expectations.
With a properly defined scope, we next must determine what, if any, materials we need to procure. These include sensors, DAQ hardware and other installation supplies. Don’t forget to include the amount of time that will be required to prepare all the materials and hardware. Think through such things as what it will take to package the DAQ hardware for any special environmental requirements. Also, be sure to consider the time it will take you to set up the software configuration file and test all the hardware and sensors prior to deployment.
We also need to consider the onsite testing requirements and location specifics. Costs can mount quickly to cover general travel and living expenses, particularly when the job will take your team to remote places for extended periods of time. You need to think about daily commutes to and from the facility as well as the cost variance for different geographic locations. Flights, vehicles, hotels and meals are crucial to estimate as accurately as possible, and that’s going to take extra research on your part. Keep in mind that travel costs are NOT one-size-fits-all.
Some projects require analysis support and some do not. It all depends on the customers’ resources and requirements. We serve customers by providing raw data files and allow them to perform their own analysis, but we also have experience providing a complete turnkey solution including data analysis. This requirement obviously needs to be defined up front in order to accurately estimate the opportunity.
You need to consider everything when estimating a project, and this commonly involves “access to the instrumentation areas” for our projects. We typically work on large, complex equipment that sometimes require additional tools and resources to access the sensor locations. This could include manlifts, scissor lifts, cranes, rope access and scaffolding. Since the equipment is quite large, you need to think about the amount of signal cable required and evaluate that against deploying a network of DAQ chassis which may be a cheaper solution than routing all sensors back to a single DAQ system. It will also be key to build in language and costs in your estimates to address unforeseen delays. For example, include factors that lie outside of your team’s control — resources not being available, no access to equipment, or even poorly performing equipment that will not allow your team to record good data.
Sensor installation can vary from a couple minutes to a couple hours depending on the application. The same is true of strain gauges. Depending on the testing environment, strain gauges can be installed quickly or become an arduous task. Some applications involve very high temperature and moisture concerns and may also need to survive for long periods of time, which may require a more robust epoxy that requires a heat cure before data can be recorded from the strain gauges. Some applications involve no environmental concern and are only needed for a very short duration. In these cases, the gauges can be installed quickly after surface prep using an industrial type fast curing epoxy. Similarly, some applications may benefit from using weldable gauges that can simply be tack welded to the specimen. This eliminates any challenges and reduces installation time by using special epoxies. These are typically much more expensive, so you must evaluate the economics of this option. In either case, the surface must be properly prepped (ground, sanded, polished) to the base material to ensure a good bond to the test piece.
Our labor rates vary by skill level. Senior engineering and programming labor, for example, costs more per hour than our regular engineering and programming labor. Similarly, sending a senior technician will cost more per hour than a technician. Finally, as is common, materials and expenses are estimated at cost plus 10%. Labor Rates Link
For more information about our testing services, contact Ryan Welker @ (844) 837-8797 x702.
Ryan Welker is a 25-year veteran in engineering, procurement and project management. Ryan currently serves as a Vice President of Operations at Integrated Test and Measurement (ITM) in Milford, Ohio. In this role, he oversees the daily operations and monitors all phases of project fulfillment, including customer inquiries, proposal development, scheduling and manpower, employee training, on-site installations, customer follow-up, and support.
Recent News: Ohio University Asphalt Cracking Prediction System Project
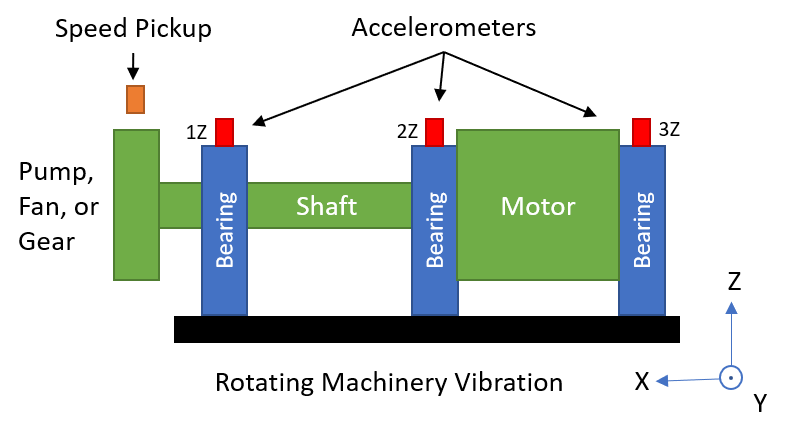
Choosing an accelerometer for rotating machinery vibration measurements can be a daunting task since there are so many options available. This blog outlines the characteristics you should consider when choosing a piezoelectric single axis accelerometer for general purpose vibration measurements and presents some accelerometers to consider.
When measuring vibration on rotating equipment such as motors, pumps, and generators, the most common measurement location(s) are on the shaft bearing housing(s) at the shaft centerline. At this location, typical vibration levels perpendicular to the shaft are < 100 g and the frequency range of interest is < 5000 Hz. A general purpose single axis piezoelectric accelerometer with either a 10 mV/g or 100 mV/g sensitivity fits this criteria.
Other characteristics to consider are size, mounting options, cable connections, grounding, and cost. Several mounting options are available. They include magnetic bases, adhesive bases and stud mounts. The mounting option you choose affects the frequency range of your accelerometer measurements. The table below shows typical frequency limits for accelerometer mounting methods.
| Mount Type | Typical Frequency Limit |
| Magnet | 2,000 Hz |
| Adhesive | 5,000 Hz |
| Stud | 6,000 Hz |
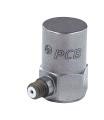
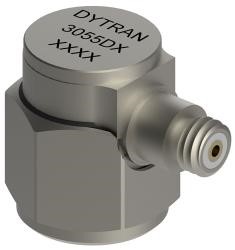
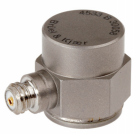
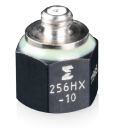
The table below shows some examples of stud mounted general purpose piezoelectric accelerometers. These accelerometers all have a female 10-32 coaxial / microdot connector. It is important to note that this is not a complete list of accelerometers and there are many options available from each manufacturer. I would encourage you to go to the websites linked in the table and see what’s available.
 |
 |
 |
 |
 |
|
| Manufacturer | PCB | Dytran | BRÜEL & KJÆR | Endevco | Kistler |
| Model # | 353B03 | 3055D1 | 4533-B | 256HX -10 | 8702B500-M1 |
| Sensitivity | 10 mV/g | 10 mV/g | 9.8 mV/g | 10 mV/g | 10 mV/g |
| Frequency Range | (±5%) 1 to 7000 Hz | (±5%) 1 to 5000 Hz | (±10%) 0.2 – 12800 Hz | (±10%) 1 to 10000 Hz | (±5%) 1-10000 Hz |
| Temperature Range | -65 to +250 °F | -67 to +250 °F | –67 to +257 °F | -67˚F to +257˚F | -67˚F to +257˚F |
| Height | 0.88 in | 0.64 in | 0.54 in | 0.55 in | 0.67 in |
| Weight | 0.38 oz | 0.35 oz | 0.3 oz | 0.14 oz | 0.32 oz |
| Housing Material | Titanium | Titanium | Titanium | Titanium | Titanium |
| Electrical Connector | 10-32 Coaxial (side) | 10-32 Coaxial (side) | 10–32 Coaxial (side) | 10–32 Coaxial (top) | 10–32 Coaxial (side) |
| Mounting Thread | 10-32 Female | 10-32 Female | 10-32 Female | 10-32 Female | 10-32 Female |
For more information about collecting vibration data, accelerometers, iTestSystem, or test equipment rental, contact Mark Yeager @ (844) 837-8797 x701.

ITM provides software development, structural and mechanical testing services, industrial monitoring, strain gauging, and data analysis solutions to clients on six continents. ITM is a recognized National Instruments Gold Alliance Partner.
![]()