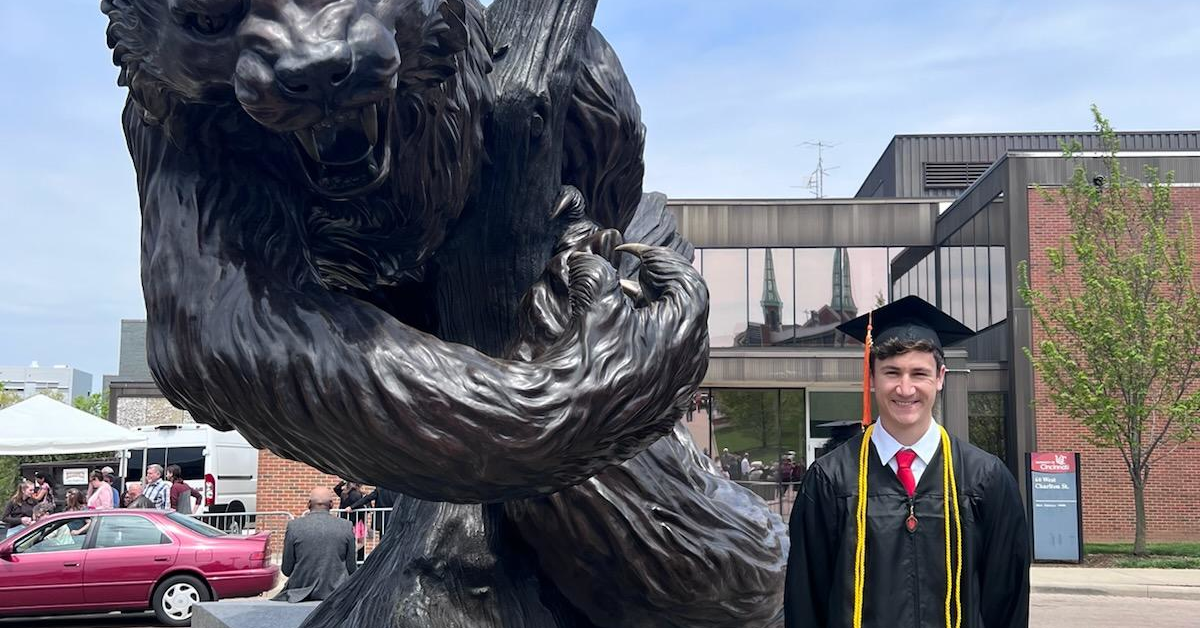
University of Cincinnati Mechanical Engineering Co-op Student next to the Bearcat statue.
Check out the Q&A with a recent UC grad who gained real-world experience doing hands-on learning
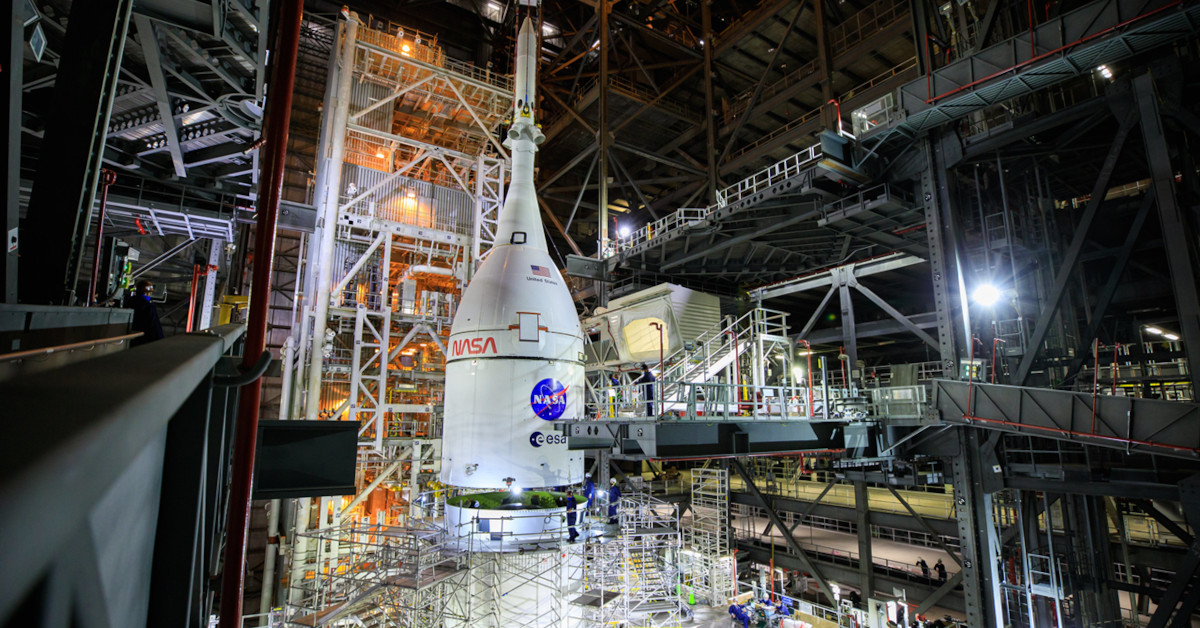
Brandon Walsh’s career came into focus in a powerful way during one of his co-op experiences with ITM. The 23-year-old recent University of Cincinnati graduate remembers the moment. He was watching a rocket launch from a distance while on an assignment with an ITM crew in Florida.
“Just watching it go up into the sky and disappear while watching a livestream and hearing updates on the rocket was pretty incredible,” he said. “It was very neat to see. It was a good five seconds after the launch that I heard and felt the blast.”
Walsh, who grew up in Fort Thomas, Kentucky, knew then that he wanted to learn all he could about aerospace. The mechanical engineering graduate is now pursuing his master’s degree in aerospace in a joint degree program that has him splitting time between UC and the University of Bordeaux.
He credits his ITM experiences for helping him lock onto his dream. Walsh co-opped with ITM in the summer of 2021 and again in the summer of 2022, so we caught up with him to learn more about his adventures.
Q:What was it like when you first started at ITM?
A:I enjoyed it from the start. During the interview, they talked about all the projects they do and all the traveling. That piqued my interest. Near the end of the interview they took me down to the lab and showed me some of the projects they were working on and all the tools that they had. Being able to go out to different parts of the country to work on various projects and having a lot of in-house projects to work on really interested me.
Q:You had co-ops at a couple of larger companies before coming to ITM. How would you compare the experiences?
A:I definitely got to do a larger variety of things at ITM. At the two previous companies, I was more set in a certain department and had a certain thing I’d do every day, every week. But at ITM I got to do a lot more hands-on stuff as well as the digital/computer side of things.
Q:What types of projects did you work on at ITM?
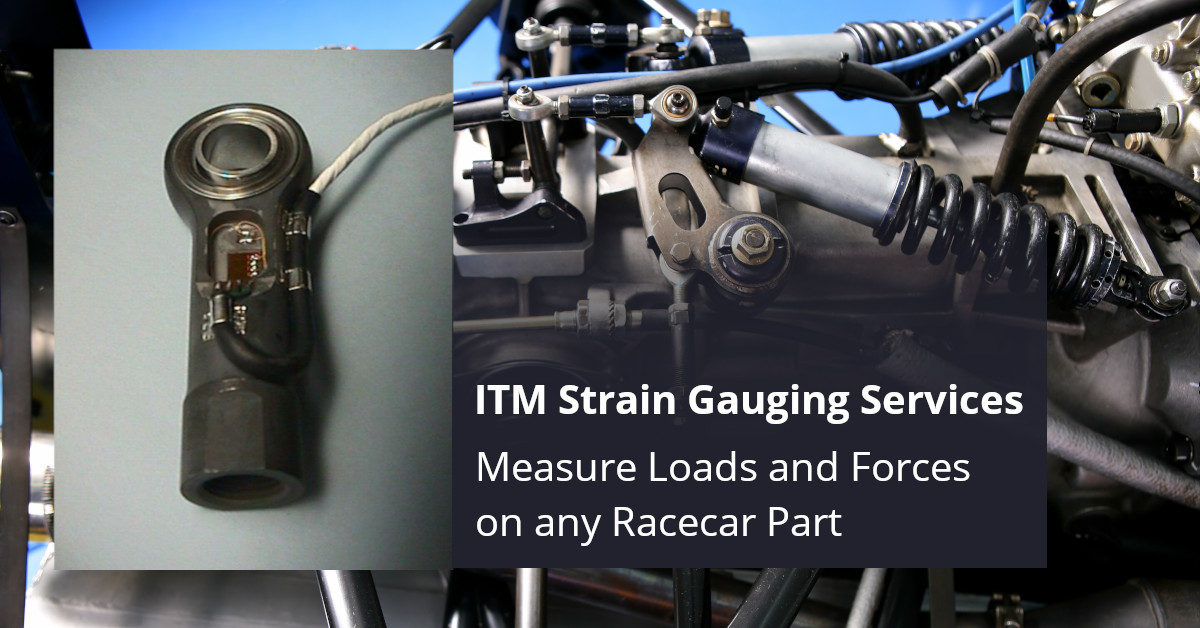
A: We did a lot of aerospace work, so trips to a space flight company. We worked on different rocket parts and got to see the process and talk to the engineering teams. We worked at an electric vehicle battery factory up in Michigan doing strain gauging. I got to go to West Texas to work in the oil fields on a project. It was just neat to see different parts of the country that I hadn’t really seen before, too.
Q:How was it getting such a wide exposure?
A: It helped further my education and understanding of the topics and things that I was working on.
Q:What stood out from your time in the lab at ITM?
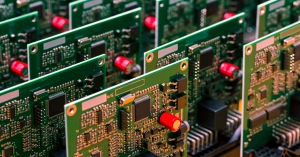
A: Just seeing how this small company was making all these very precise and nice looking panels for (a world renowned equipment company) was really impressive. I got to practice and work on my skills soldering and using a drill press and taps and other tools.
Q: So, a lot of helpful hands-on work?
A: Yes. I’m definitely better at soldering now than when I started.
Q:Talk to me about the culture at ITM.
A:I enjoyed working with all the different levels of people there. It was easy to talk to all of them, and they had different amounts of knowledge and ways to relate to me. They were able to provide different pieces of advice and things that helped me along the way.
Q:Did the experience at ITM help shape where you wanted to head with your career?
A:Yeah. Definitely. It really confirmed that I want to go into aerospace. I hope to work in the field of aircraft or spacecraft.
Q:So seeing a rocket launch in person ignited something in you?
A: Yeah. That helped open my eyes.
For more information about employment or co-op opportunities contact Josh Fishback via phone: (844) 837-8797 or email: josh.fishback@itestsystem.com.