
ITM Co-op Helps Engineering Student Set Sights Even Higher
ITM Co-op Helps Engineering Student Set Sights Even Higher
Tyler House’s dream career began to come into sharper focus during his spring co-op at Integrated Test & Measurement.
After four months at the Milford, Ohio, firm the University of Cincinnati electrical engineering student headed into his summer feeling both excited by his work experience and inspired to emulate ITM CEO Tim Carlier one day by starting his own company.
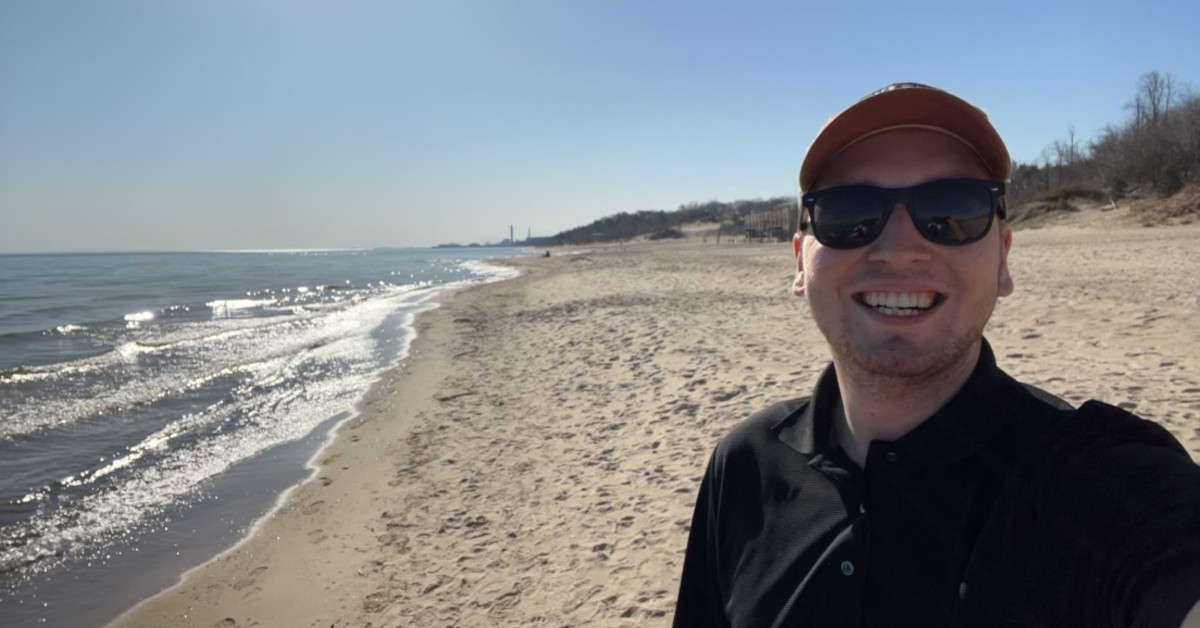
“I know I want to do something I love,” said Tyler, who had just returned from a trip to Disney with his girlfriend to celebrate the end of the semester. “I’d like to start my own company someday. I’ve been poking at that idea. Definitely a big dream of mine is having that freedom and doing something that means a lot to me.”
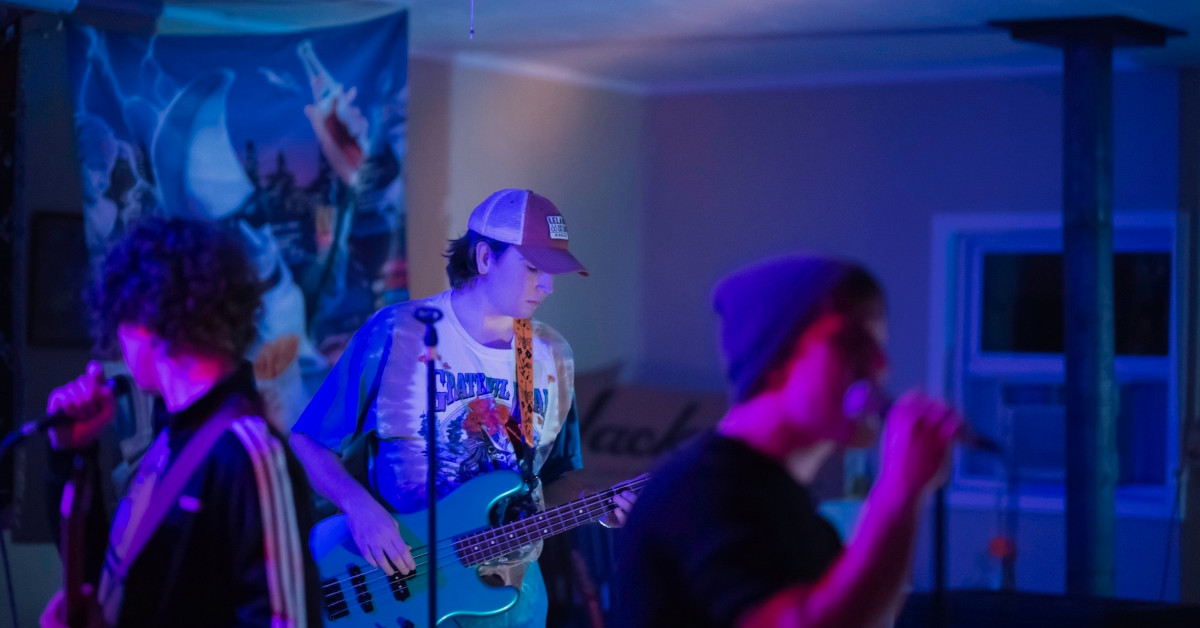
Perhaps the only thing that equals Tyler’s love of engineering is his love of music. He and a few fellow graduates from Clermont Northeastern (CNE) high school started a band called Wishbone, which has started lining up local gigs to cover rock and blues tunes stretching back a half century.
Tyler’s two worlds collided on the last day of his co-op when a couple of engineers from ITM dropped into his band’s “first bonafide show.”
“It was so much fun watching their reaction,” said Tyler, who employs his electrical engineering skills to repair the band’s gear when things inevitably break. “I love that they came.”
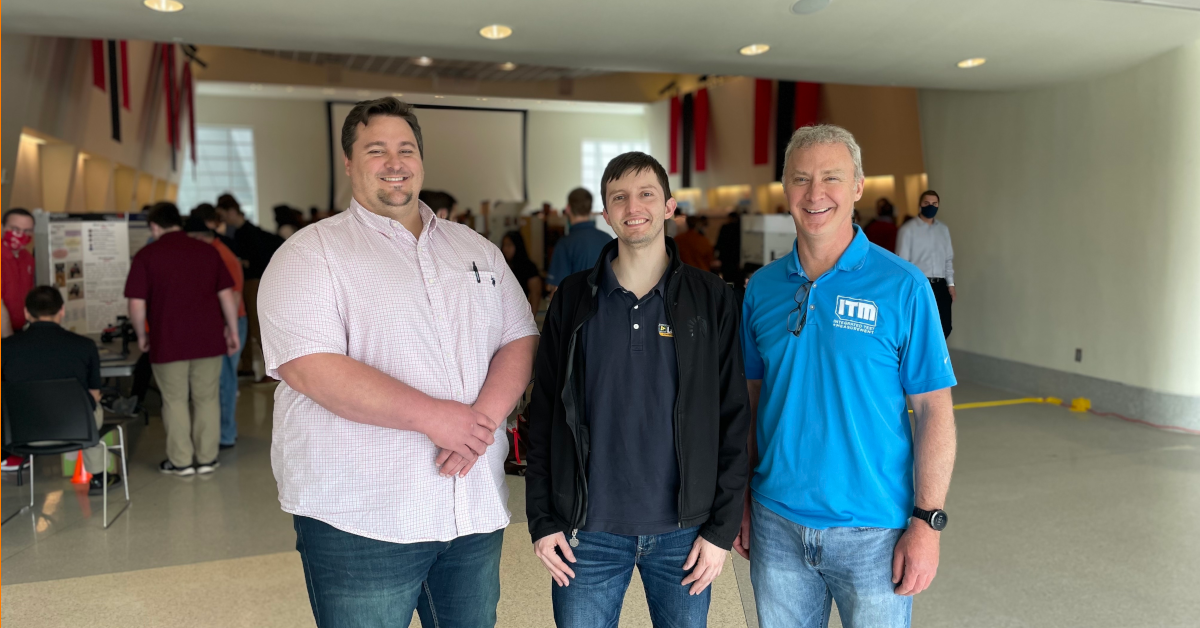
Coincidentally, like Wishbone, ITM’s entire leadership team — the CEO, VP of Operations, Lead Programmer and Administrative Director — are all CNE graduates. For Tyler, seeing that level of success from the same small high school as him was only more of a confidence lift.
He loves the entrepreneurial and inventive culture at ITM, where staff members are constantly tackling new challenges. “It’s really just a great place to figure out what you are into,” he said.
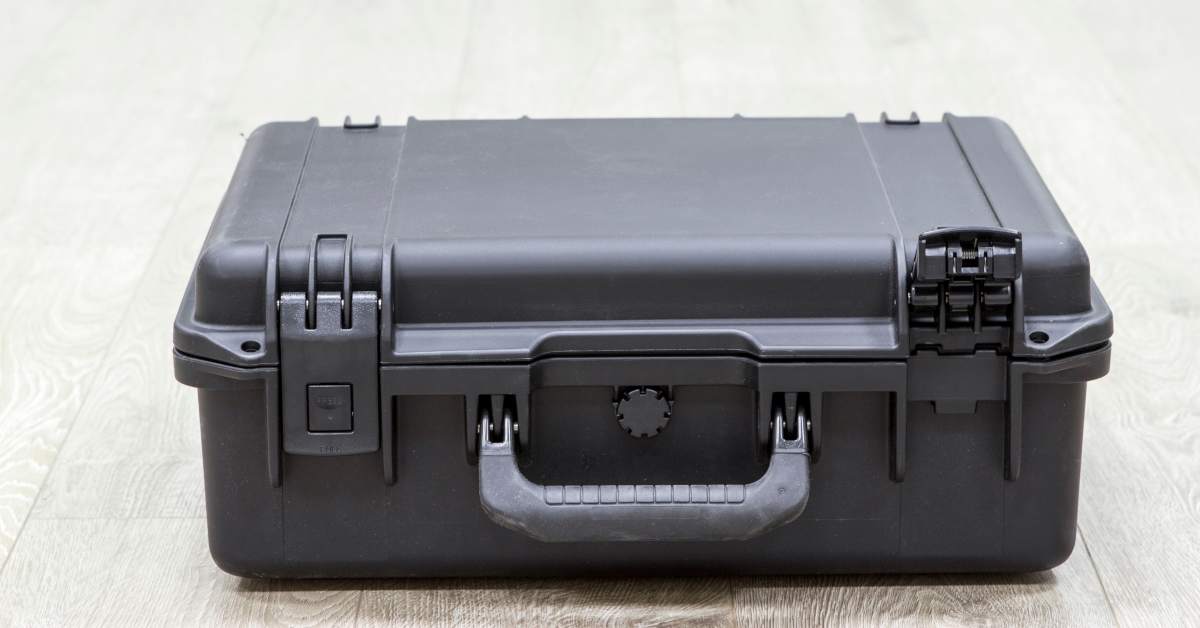
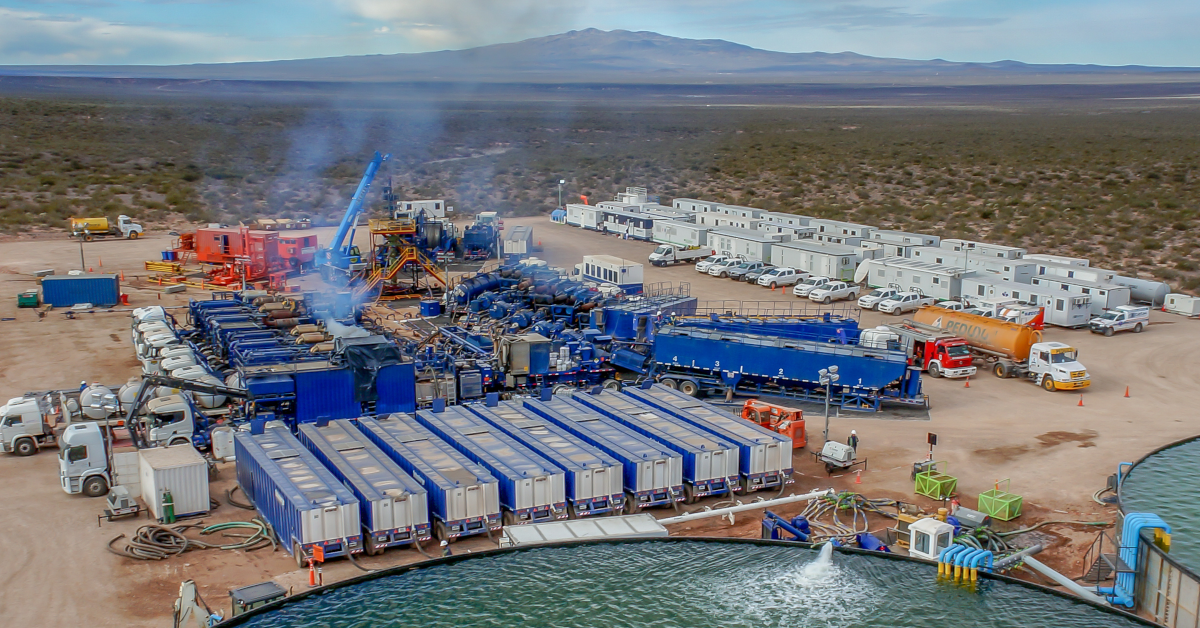
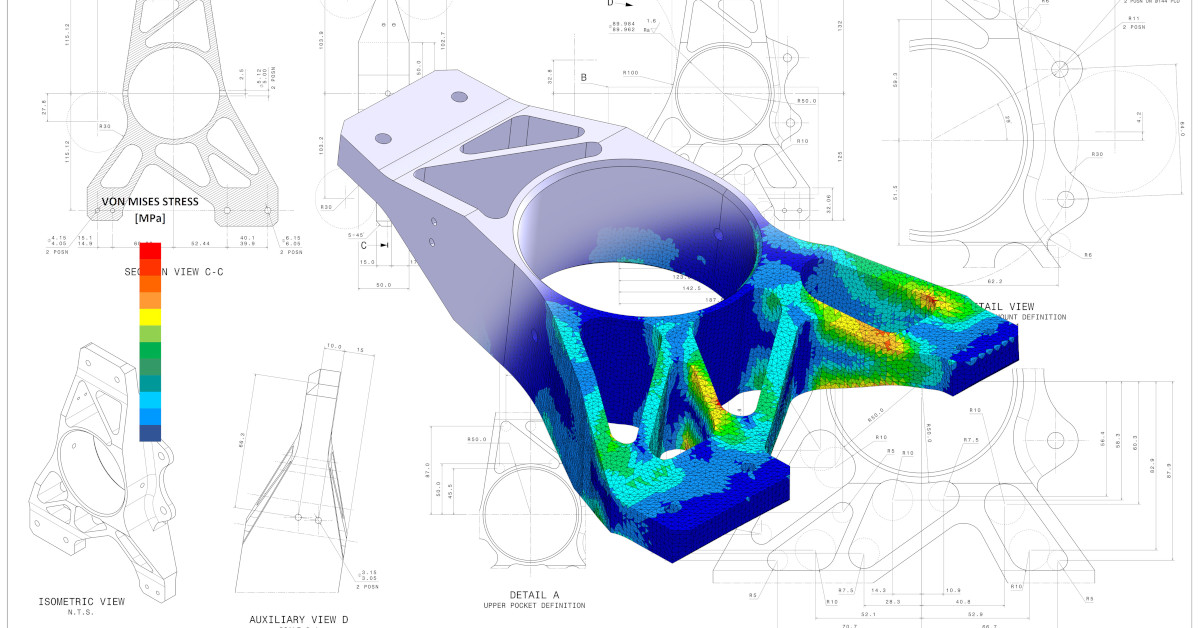
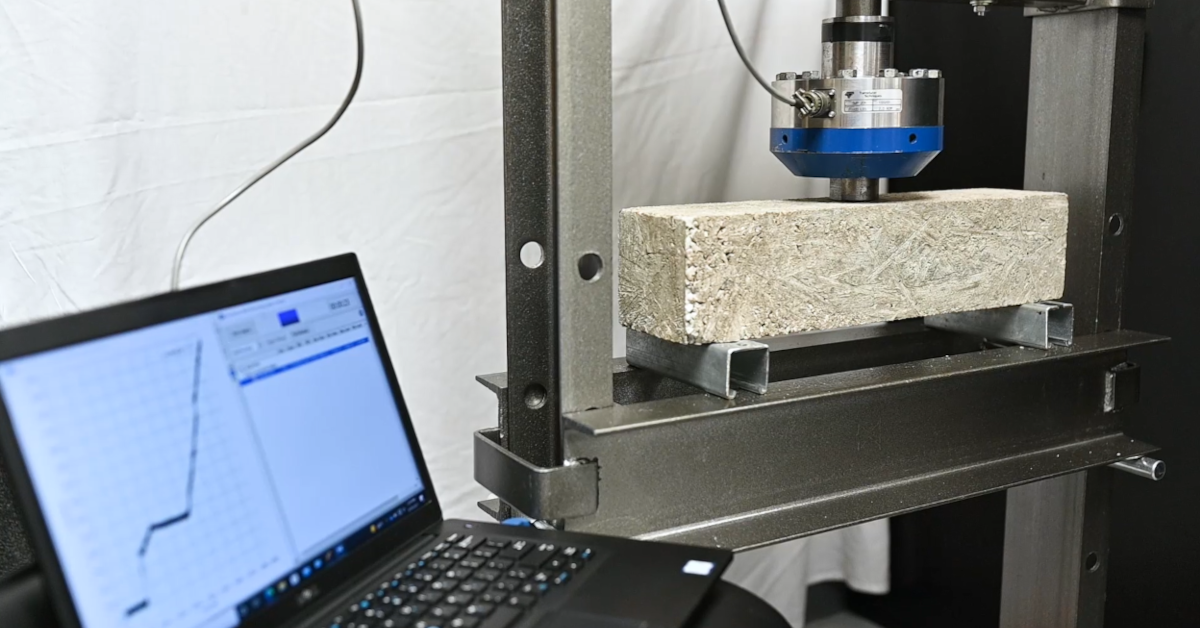
Tyler found himself learning a ton about Fusion 360, a cloud-based 3D modeling program, while researching mechanical properties and simulating failure modes on a bolted joint. He said he spent about half his co-op in the office doing things like assembling Data Acquisition (DAQ) boxes and the other half on the road working on-site. Experiences included everything from climbing inside massive paper mills to helping gather data on equipment operating in remote locations all over the country.
“In talking with my friends who have had co-ops, it’s hard to get to work in a place where you feel like you can make a difference and actually help fix problems,” said Tyler. “I definitely felt that. I learned really fast about how to deal with mistakes and just general problem solving.”
Besides the on-the-job learning, he loved exploring new places, national parks and more with the ITM crew after hours. He’s hoping to pick up some work helping ITM with any projects through the summer, and he’s interested in returning during his next co-op rotation in Spring of 2023.
Meanwhile, he’ll keep poking at his dream of someday owning his own company.
“You just have to go out there and get it,” Tyler said. “If you are aggressive about it, you will fail a bunch. But you’ve got to be able to get up off the ground and just keep rolling with it.”
For more information about Co-op or employment opportunities at ITM, contact Josh Fishback via email at josh.fishback@itestsystem.com or phone at (844) 837-8797 x705.


