LabVIEW Channel: Splitter Bars
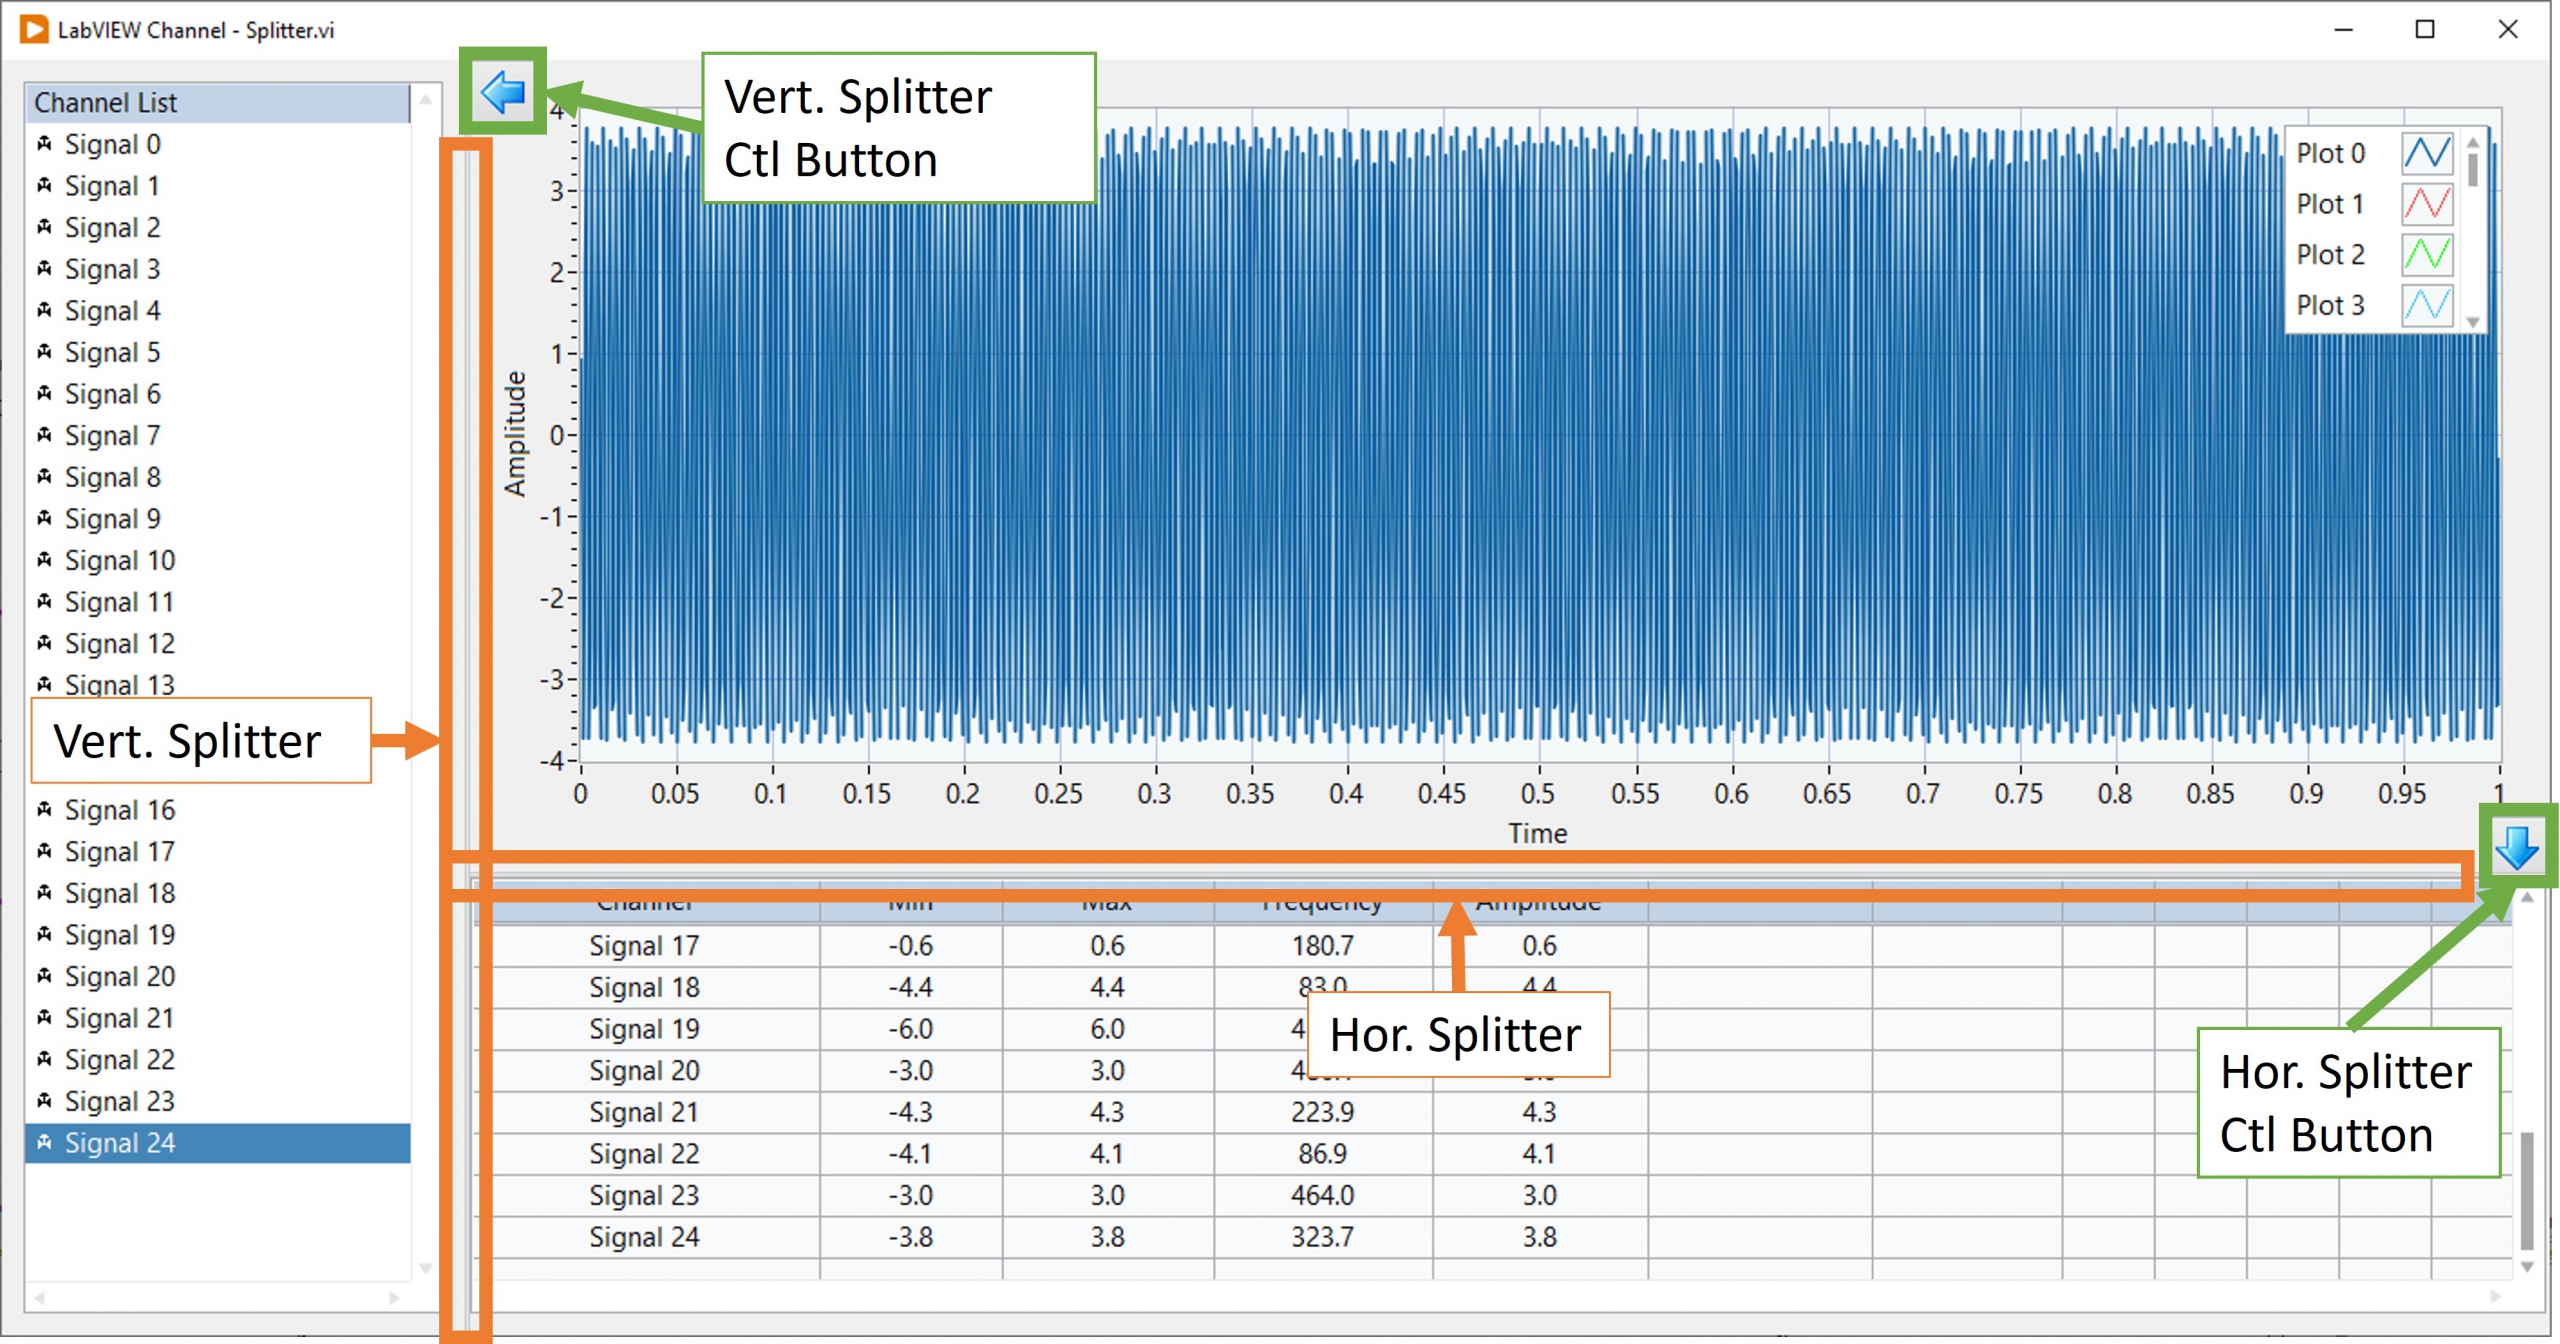
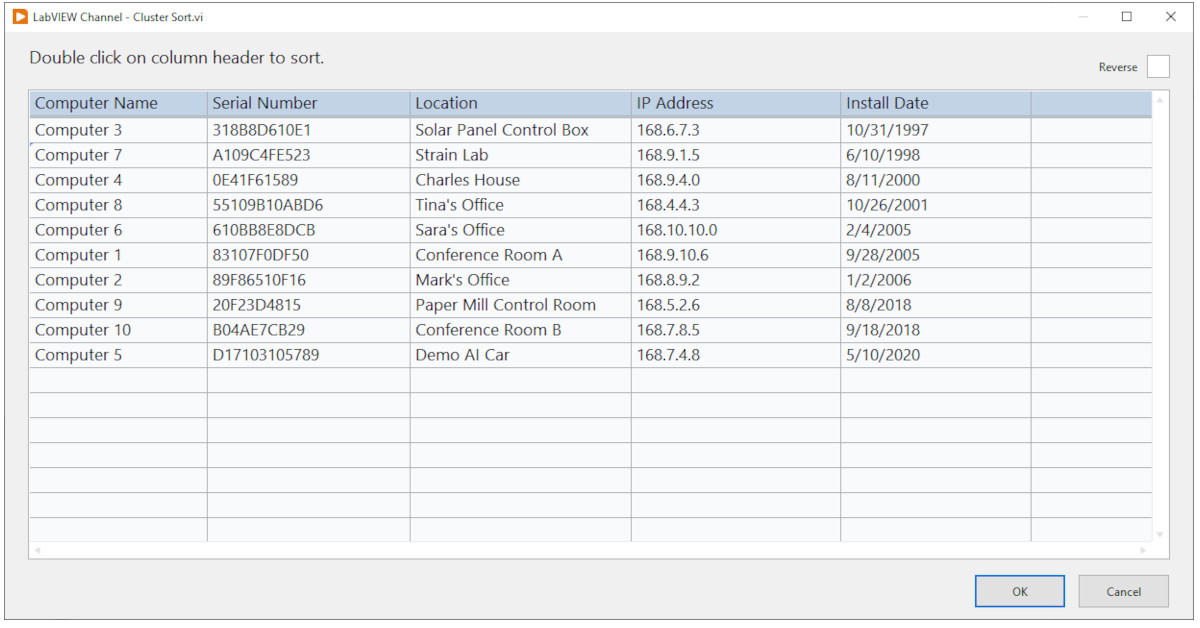
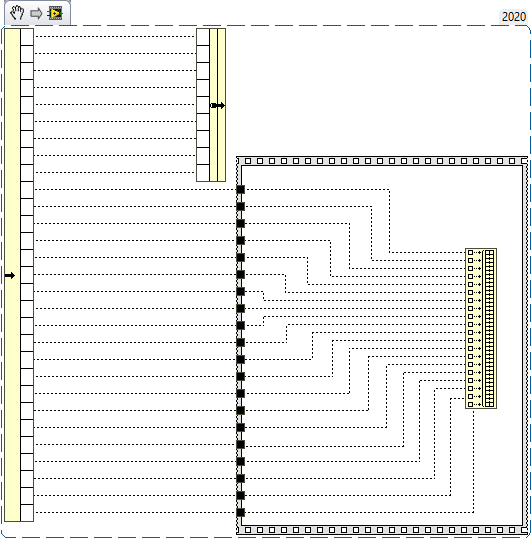
Figure 1: Example LabVIEW Front panel with Splitter Bars
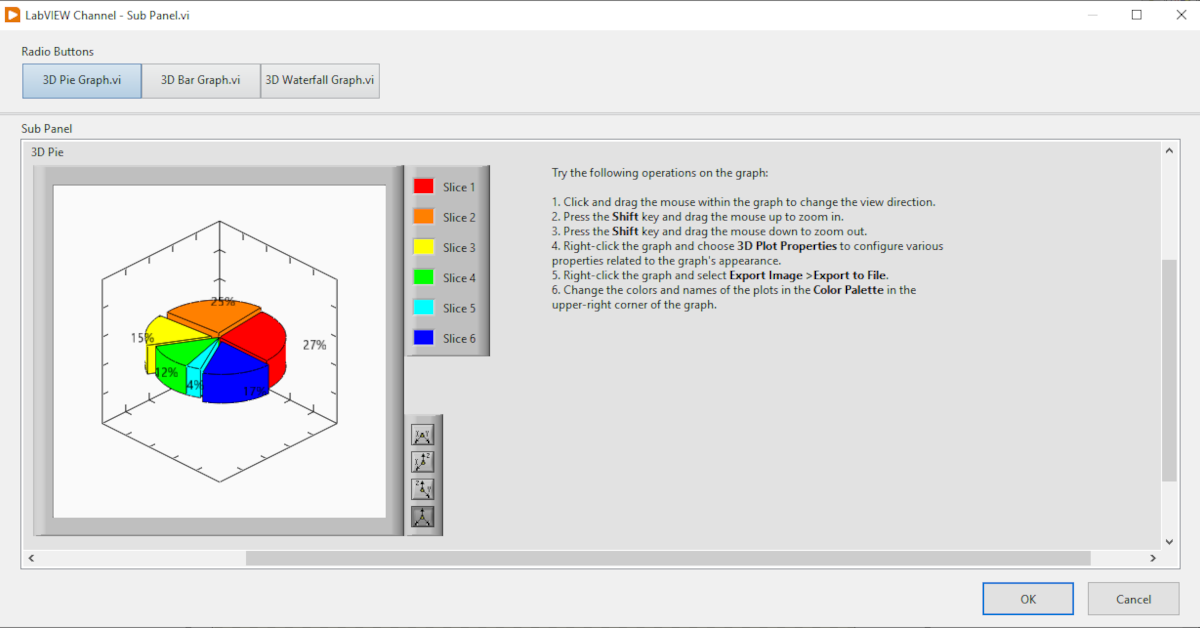
In some of my earlier LabVIEW channel blogs I showed how to use a subpanel to build scalable module user interfaces. This blog describes another front panel layout tool for creating professional scalable user interfaces – the splitter bar. Splitter bars allow the user to resize the adjacent panes while an application runs. NI explains the functionality of configure of splitter bars here.
The labVIEW example described below shows how splitters can be moved programmatically to create clean professional user interfaces. This VI contains five (5) controls/indicators and two (2) splitter bars on the front panel. A listbox is used to select which channels are displayed in the graph, while a table displays each channel’s statistics. Each splitter bar’s position is controlled by a radio button containing two buttons (left and right for the vertical splitter and up and down for the horizontal splitter). When a splitter control button is initially pressed, its respective splitter bar snaps to the edge of the window and hiding the listbox or table. When pressed again, the respective splitter moves back to its original position revealing the listbox or table.
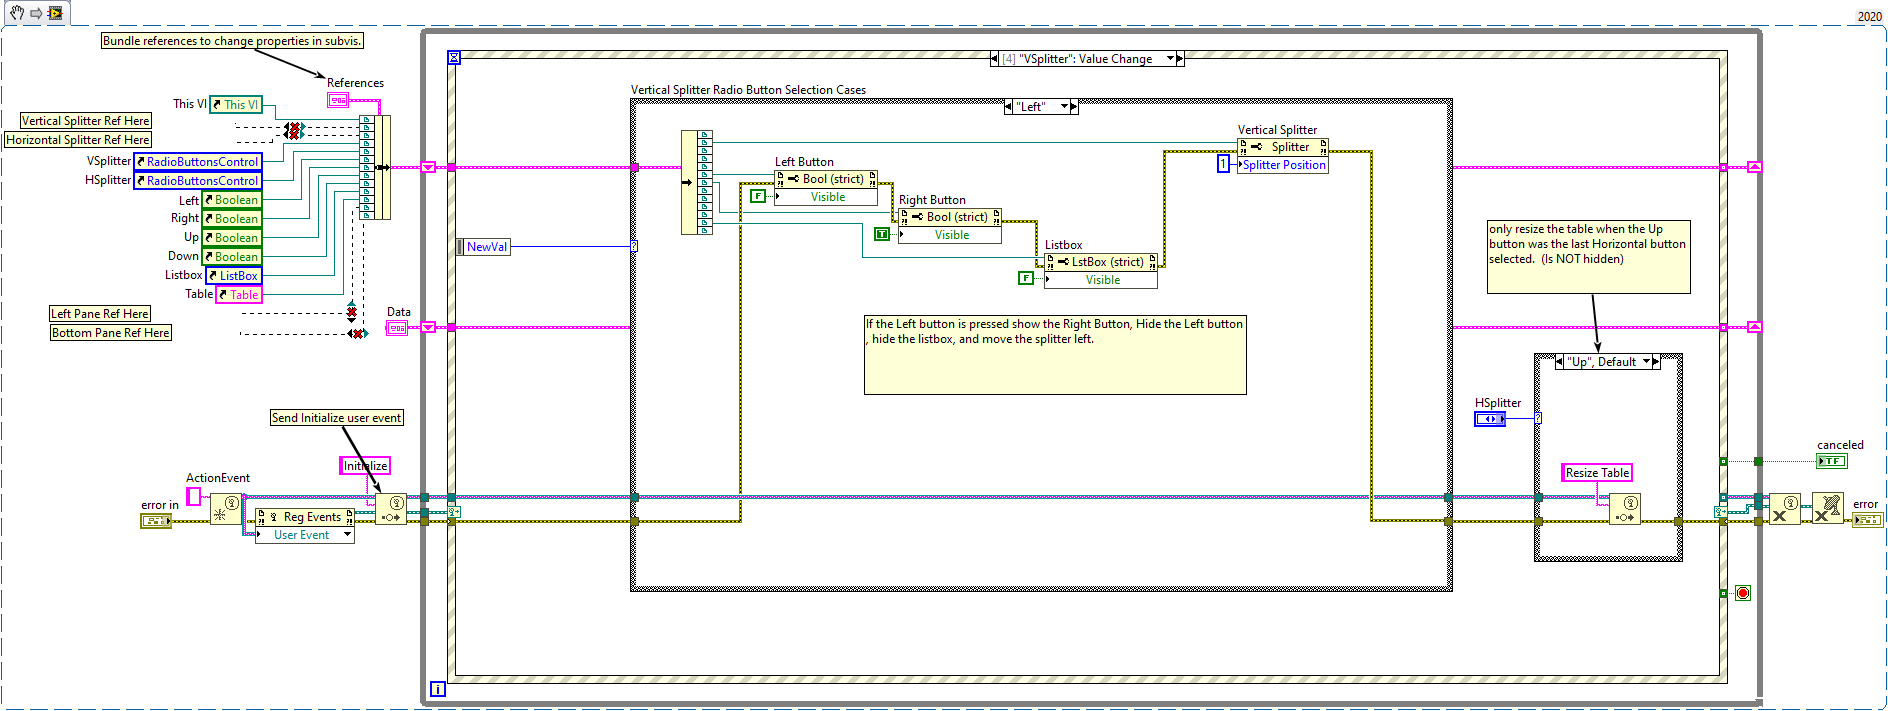
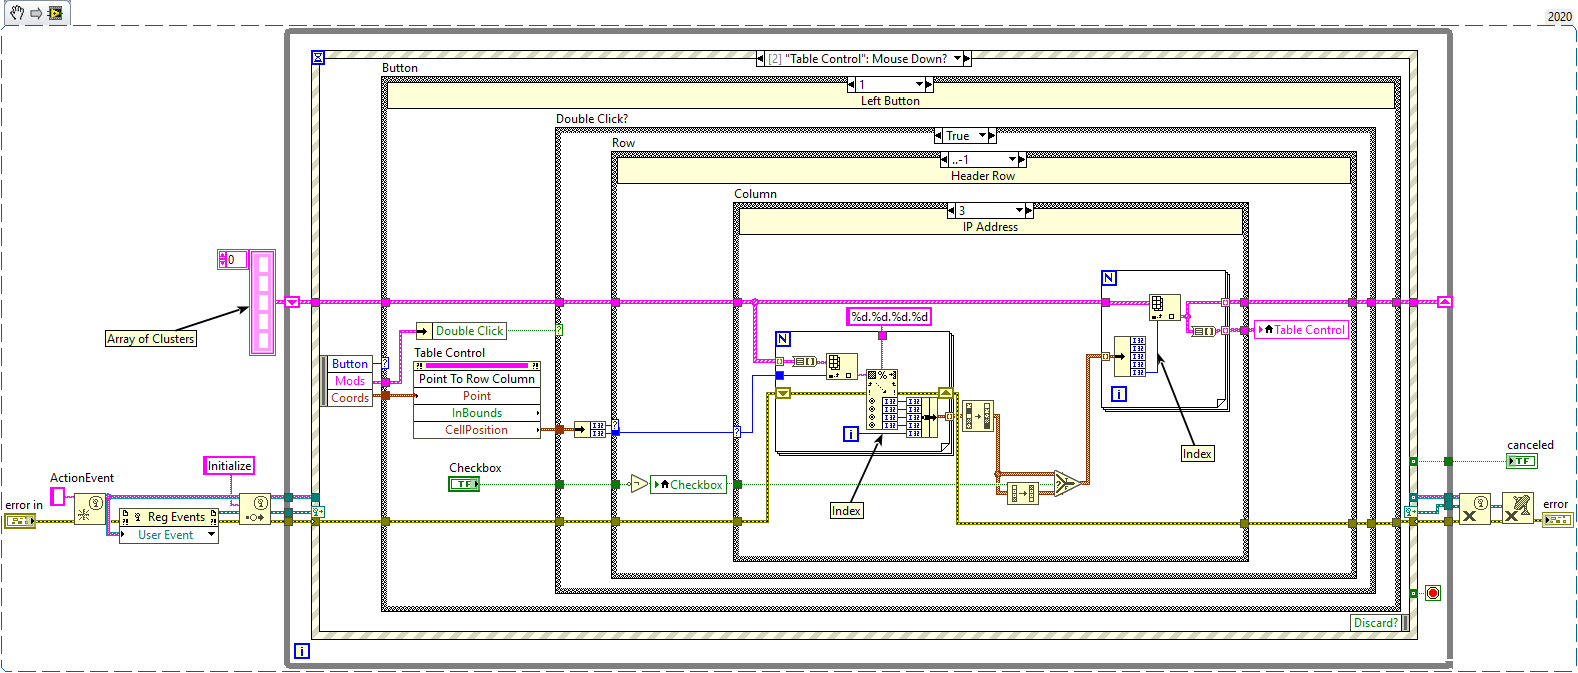
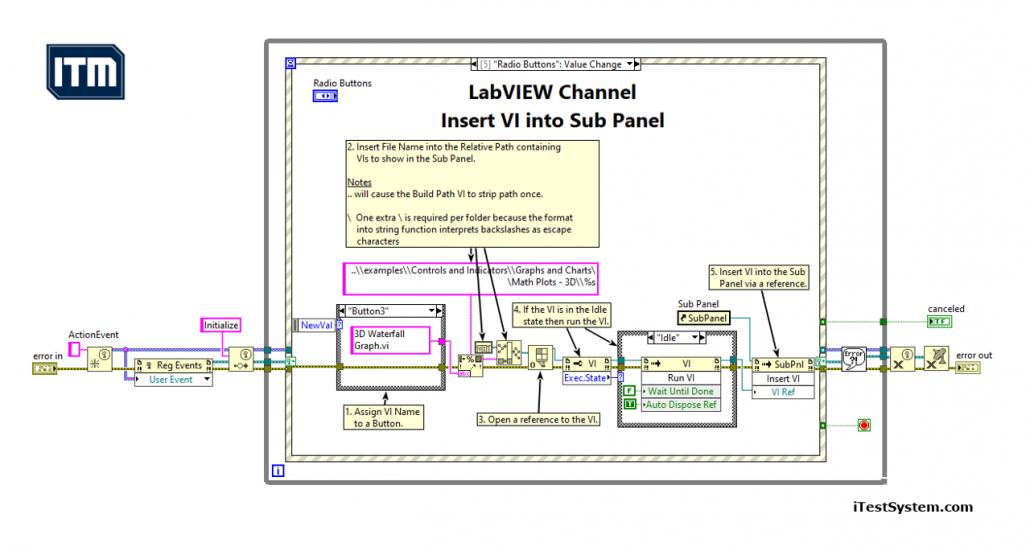
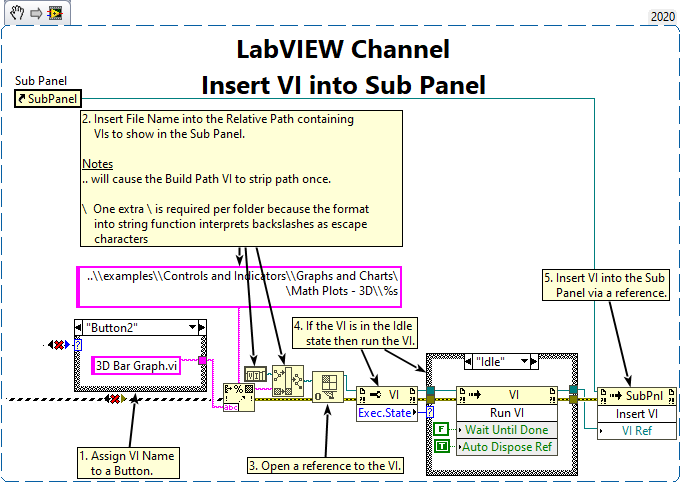
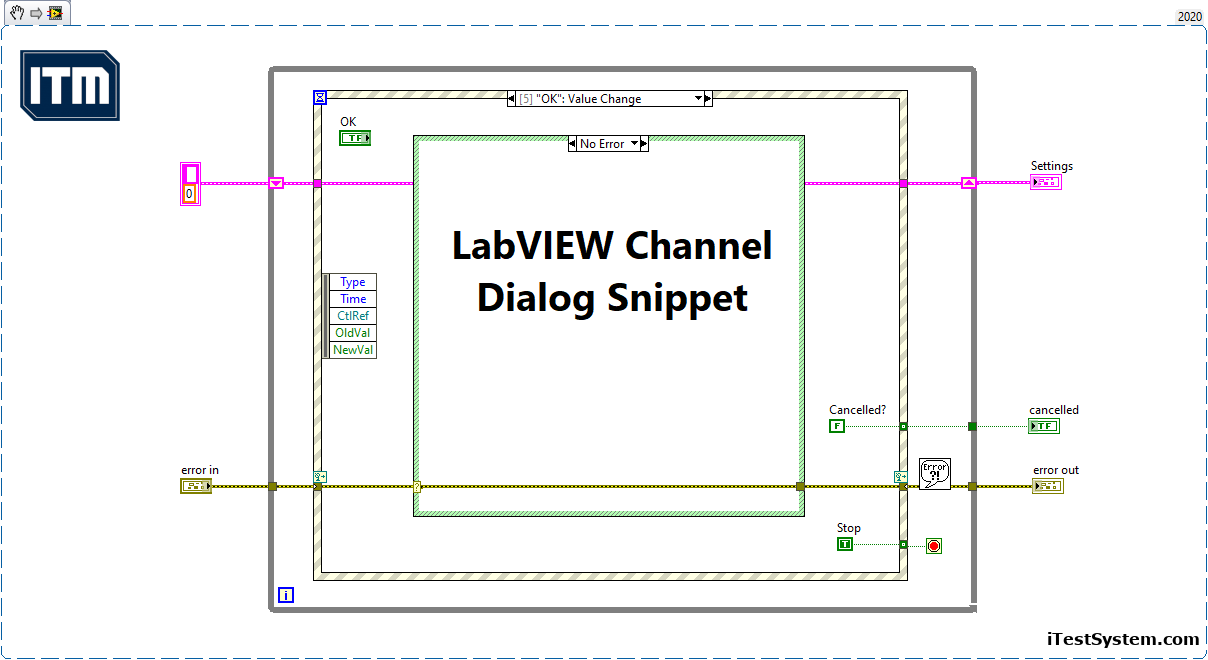
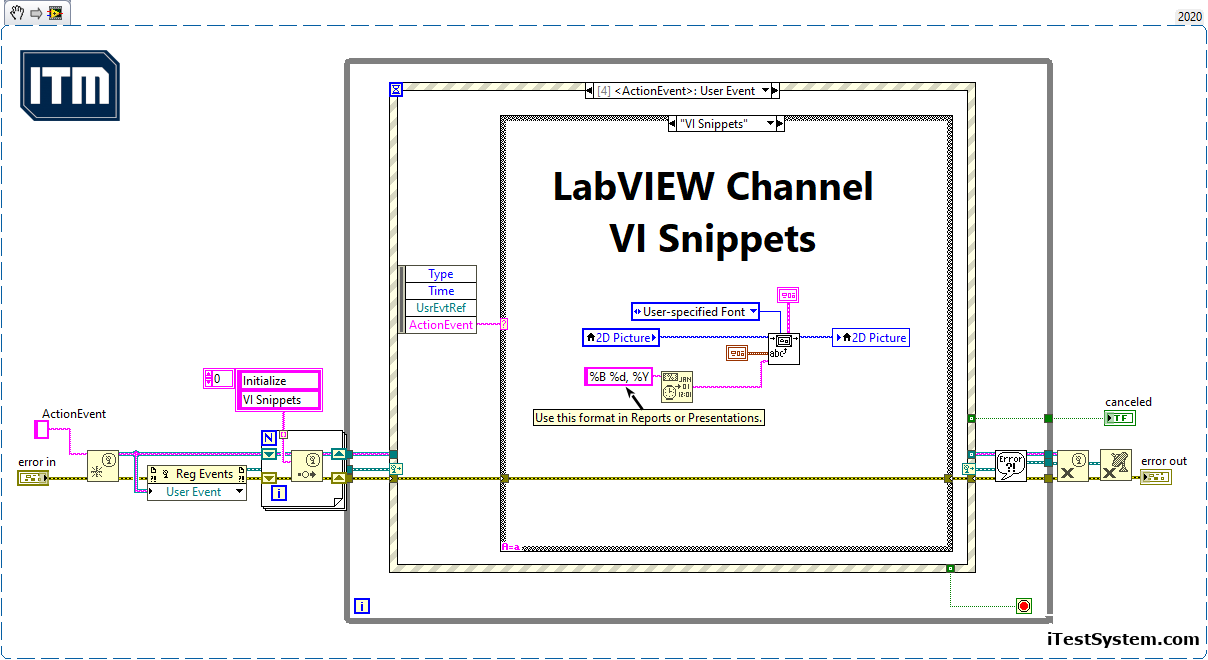
Figure 2: Programmatically move splitter bars.
Try the LabVIEW snippet above to see the splitter functionality. When you drop this snippet into a new VI, you will have to add vertical and horizontal splitters to the VI. See figure 1 for a reference for where to place the splitters. Right click on the splitter to get a reference to each splitter, left pane and bottom pane to run the VI. Wire these references into the appropriate bundle function. Set the graph to scale with panel. Do not set the listbox and table to scale with pane.
For more information about this splitter example, or our LabVIEW programming services contact Mark Yeager @ (844) 837-8797 x7041. You can also email me at mark.yeager@itestsystem.com if you would like me to send you the example vi or download it here.