Process Optimization with Embedded Monitoring Systems
Finding efficiency improvements and uncovering hidden unsafe conditions in a process can prevent injury and save your company millions.

The Pulp & Paper category contains Case studies and blogs related to pulp & paper engineering services.
Finding efficiency improvements and uncovering hidden unsafe conditions in a process can prevent injury and save your company millions.

ITM stake holders, we have recently received good news from the US Patent Office. They have recently allowed claims relating to the use of vibration measuring devices to evaluate the operation of a sootblower (US20190041201A1). This allowance strengthens the protection of the sootblower health and fouling detection features of ITM’s Sootblower Fouling Detection (SFD) Technology.
Additional Claims: “A method of evaluating an operation of a sootblower in a boiler system, the method comprising: operating a sootblower having a rotating lance tube; measuring a vibration in the boiler system caused by the operation of the sootblower, wherein the vibration is measured with a vibration measuring device; and analyzing the measured vibration to evaluate the operation of the sootblower.”
US Patent #: US20190041201A1
For more information about ITM’s SFD Technology or other Boiler Monitoring Systems, contact Ryan Welker @ (844) 837-8797 x702
Related Links

If the COVID-19 pandemic has proven anything, it is that we live in a business climate where efficiency and accuracy have never been more important. In other words, none of us can afford to make costly mistakes.
With that in mind, I’d like to share some tips for you to consider when it comes to this important question: How Do You Estimate Test Engineering Services Costs?
For engineers, testing engineers and managers who find themselves estimating jobs, getting this step right will prove crucial not only to the success of your projects and bottom line, but also to the trust you build with your clients.
The most important requirement is to properly define the project scope of work. This will not only help you determine the necessary hardware, software, and resources required, but it will also help you identify the customer’s expectations and project deliverables. Properly defining the scope of work will help eliminate or minimize overall project time, as it will prevent delays both during the preparation phase and testing phases. Defining the scope of work will require a deep-dive discussion with your client to fully understand their challenges and goals. Remember not to leave vague language in your proposals. In other words, be sure to define who is responsible to provide all that will be needed to fulfill the project. Without a clear definition of the requirements and deliverables, it leaves a lot open for misinterpretation and expectations.
With a properly defined scope, we next must determine what, if any, materials we need to procure. These include sensors, DAQ hardware and other installation supplies. Don’t forget to include the amount of time that will be required to prepare all the materials and hardware. Think through such things as what it will take to package the DAQ hardware for any special environmental requirements. Also, be sure to consider the time it will take you to set up the software configuration file and test all the hardware and sensors prior to deployment.
We also need to consider the onsite testing requirements and location specifics. Costs can mount quickly to cover general travel and living expenses, particularly when the job will take your team to remote places for extended periods of time. You need to think about daily commutes to and from the facility as well as the cost variance for different geographic locations. Flights, vehicles, hotels and meals are crucial to estimate as accurately as possible, and that’s going to take extra research on your part. Keep in mind that travel costs are NOT one-size-fits-all.
Some projects require analysis support and some do not. It all depends on the customers’ resources and requirements. We serve customers by providing raw data files and allow them to perform their own analysis, but we also have experience providing a complete turnkey solution including data analysis. This requirement obviously needs to be defined up front in order to accurately estimate the opportunity.
You need to consider everything when estimating a project, and this commonly involves “access to the instrumentation areas” for our projects. We typically work on large, complex equipment that sometimes require additional tools and resources to access the sensor locations. This could include manlifts, scissor lifts, cranes, rope access and scaffolding. Since the equipment is quite large, you need to think about the amount of signal cable required and evaluate that against deploying a network of DAQ chassis which may be a cheaper solution than routing all sensors back to a single DAQ system. It will also be key to build in language and costs in your estimates to address unforeseen delays. For example, include factors that lie outside of your team’s control — resources not being available, no access to equipment, or even poorly performing equipment that will not allow your team to record good data.
Sensor installation can vary from a couple minutes to a couple hours depending on the application. The same is true of strain gauges. Depending on the testing environment, strain gauges can be installed quickly or become an arduous task. Some applications involve very high temperature and moisture concerns and may also need to survive for long periods of time, which may require a more robust epoxy that requires a heat cure before data can be recorded from the strain gauges. Some applications involve no environmental concern and are only needed for a very short duration. In these cases, the gauges can be installed quickly after surface prep using an industrial type fast curing epoxy. Similarly, some applications may benefit from using weldable gauges that can simply be tack welded to the specimen. This eliminates any challenges and reduces installation time by using special epoxies. These are typically much more expensive, so you must evaluate the economics of this option. In either case, the surface must be properly prepped (ground, sanded, polished) to the base material to ensure a good bond to the test piece.
Our labor rates vary by skill level. Senior engineering and programming labor, for example, costs more per hour than our regular engineering and programming labor. Similarly, sending a senior technician will cost more per hour than a technician. Finally, as is common, materials and expenses are estimated at cost plus 10%. Labor Rates Link
For more information about our testing services, contact Ryan Welker @ (844) 837-8797 x702.
Ryan Welker is a 25-year veteran in engineering, procurement and project management. Ryan currently serves as a Vice President of Operations at Integrated Test and Measurement (ITM) in Milford, Ohio. In this role, he oversees the daily operations and monitors all phases of project fulfillment, including customer inquiries, proposal development, scheduling and manpower, employee training, on-site installations, customer follow-up, and support.
Recent News: Ohio University Asphalt Cracking Prediction System Project
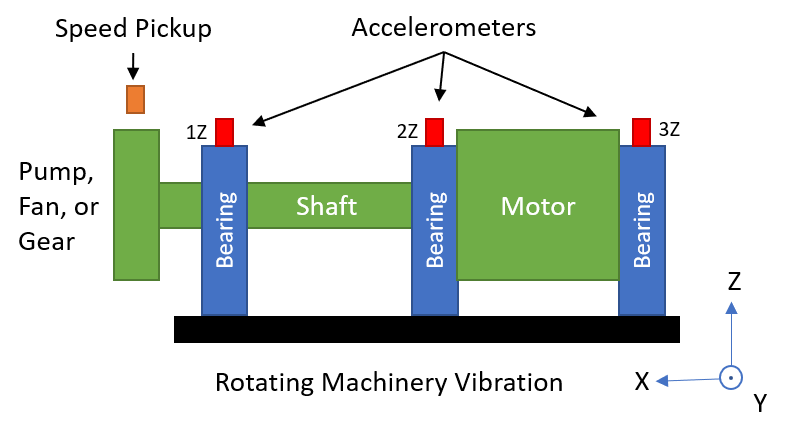
Choosing an accelerometer for rotating machinery vibration measurements can be a daunting task since there are so many options available. This blog outlines the characteristics you should consider when choosing a piezoelectric single axis accelerometer for general purpose vibration measurements and presents some accelerometers to consider.
When measuring vibration on rotating equipment such as motors, pumps, and generators, the most common measurement location(s) are on the shaft bearing housing(s) at the shaft centerline. At this location, typical vibration levels perpendicular to the shaft are < 100 g and the frequency range of interest is < 5000 Hz. A general purpose single axis piezoelectric accelerometer with either a 10 mV/g or 100 mV/g sensitivity fits this criteria.
Other characteristics to consider are size, mounting options, cable connections, grounding, and cost. Several mounting options are available. They include magnetic bases, adhesive bases and stud mounts. The mounting option you choose affects the frequency range of your accelerometer measurements. The table below shows typical frequency limits for accelerometer mounting methods.
| Mount Type | Typical Frequency Limit |
| Magnet | 2,000 Hz |
| Adhesive | 5,000 Hz |
| Stud | 6,000 Hz |
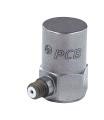
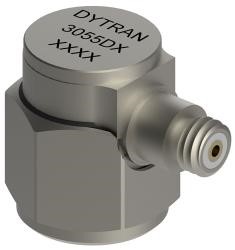
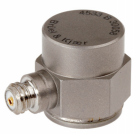
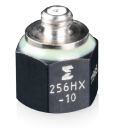
The table below shows some examples of stud mounted general purpose piezoelectric accelerometers. These accelerometers all have a female 10-32 coaxial / microdot connector. It is important to note that this is not a complete list of accelerometers and there are many options available from each manufacturer. I would encourage you to go to the websites linked in the table and see what’s available.
 |
 |
 |
 |
 |
|
| Manufacturer | PCB | Dytran | BRÜEL & KJÆR | Endevco | Kistler |
| Model # | 353B03 | 3055D1 | 4533-B | 256HX -10 | 8702B500-M1 |
| Sensitivity | 10 mV/g | 10 mV/g | 9.8 mV/g | 10 mV/g | 10 mV/g |
| Frequency Range | (±5%) 1 to 7000 Hz | (±5%) 1 to 5000 Hz | (±10%) 0.2 – 12800 Hz | (±10%) 1 to 10000 Hz | (±5%) 1-10000 Hz |
| Temperature Range | -65 to +250 °F | -67 to +250 °F | –67 to +257 °F | -67˚F to +257˚F | -67˚F to +257˚F |
| Height | 0.88 in | 0.64 in | 0.54 in | 0.55 in | 0.67 in |
| Weight | 0.38 oz | 0.35 oz | 0.3 oz | 0.14 oz | 0.32 oz |
| Housing Material | Titanium | Titanium | Titanium | Titanium | Titanium |
| Electrical Connector | 10-32 Coaxial (side) | 10-32 Coaxial (side) | 10–32 Coaxial (side) | 10–32 Coaxial (top) | 10–32 Coaxial (side) |
| Mounting Thread | 10-32 Female | 10-32 Female | 10-32 Female | 10-32 Female | 10-32 Female |
For more information about collecting vibration data, accelerometers, iTestSystem, or test equipment rental, contact Mark Yeager @ (844) 837-8797 x701.
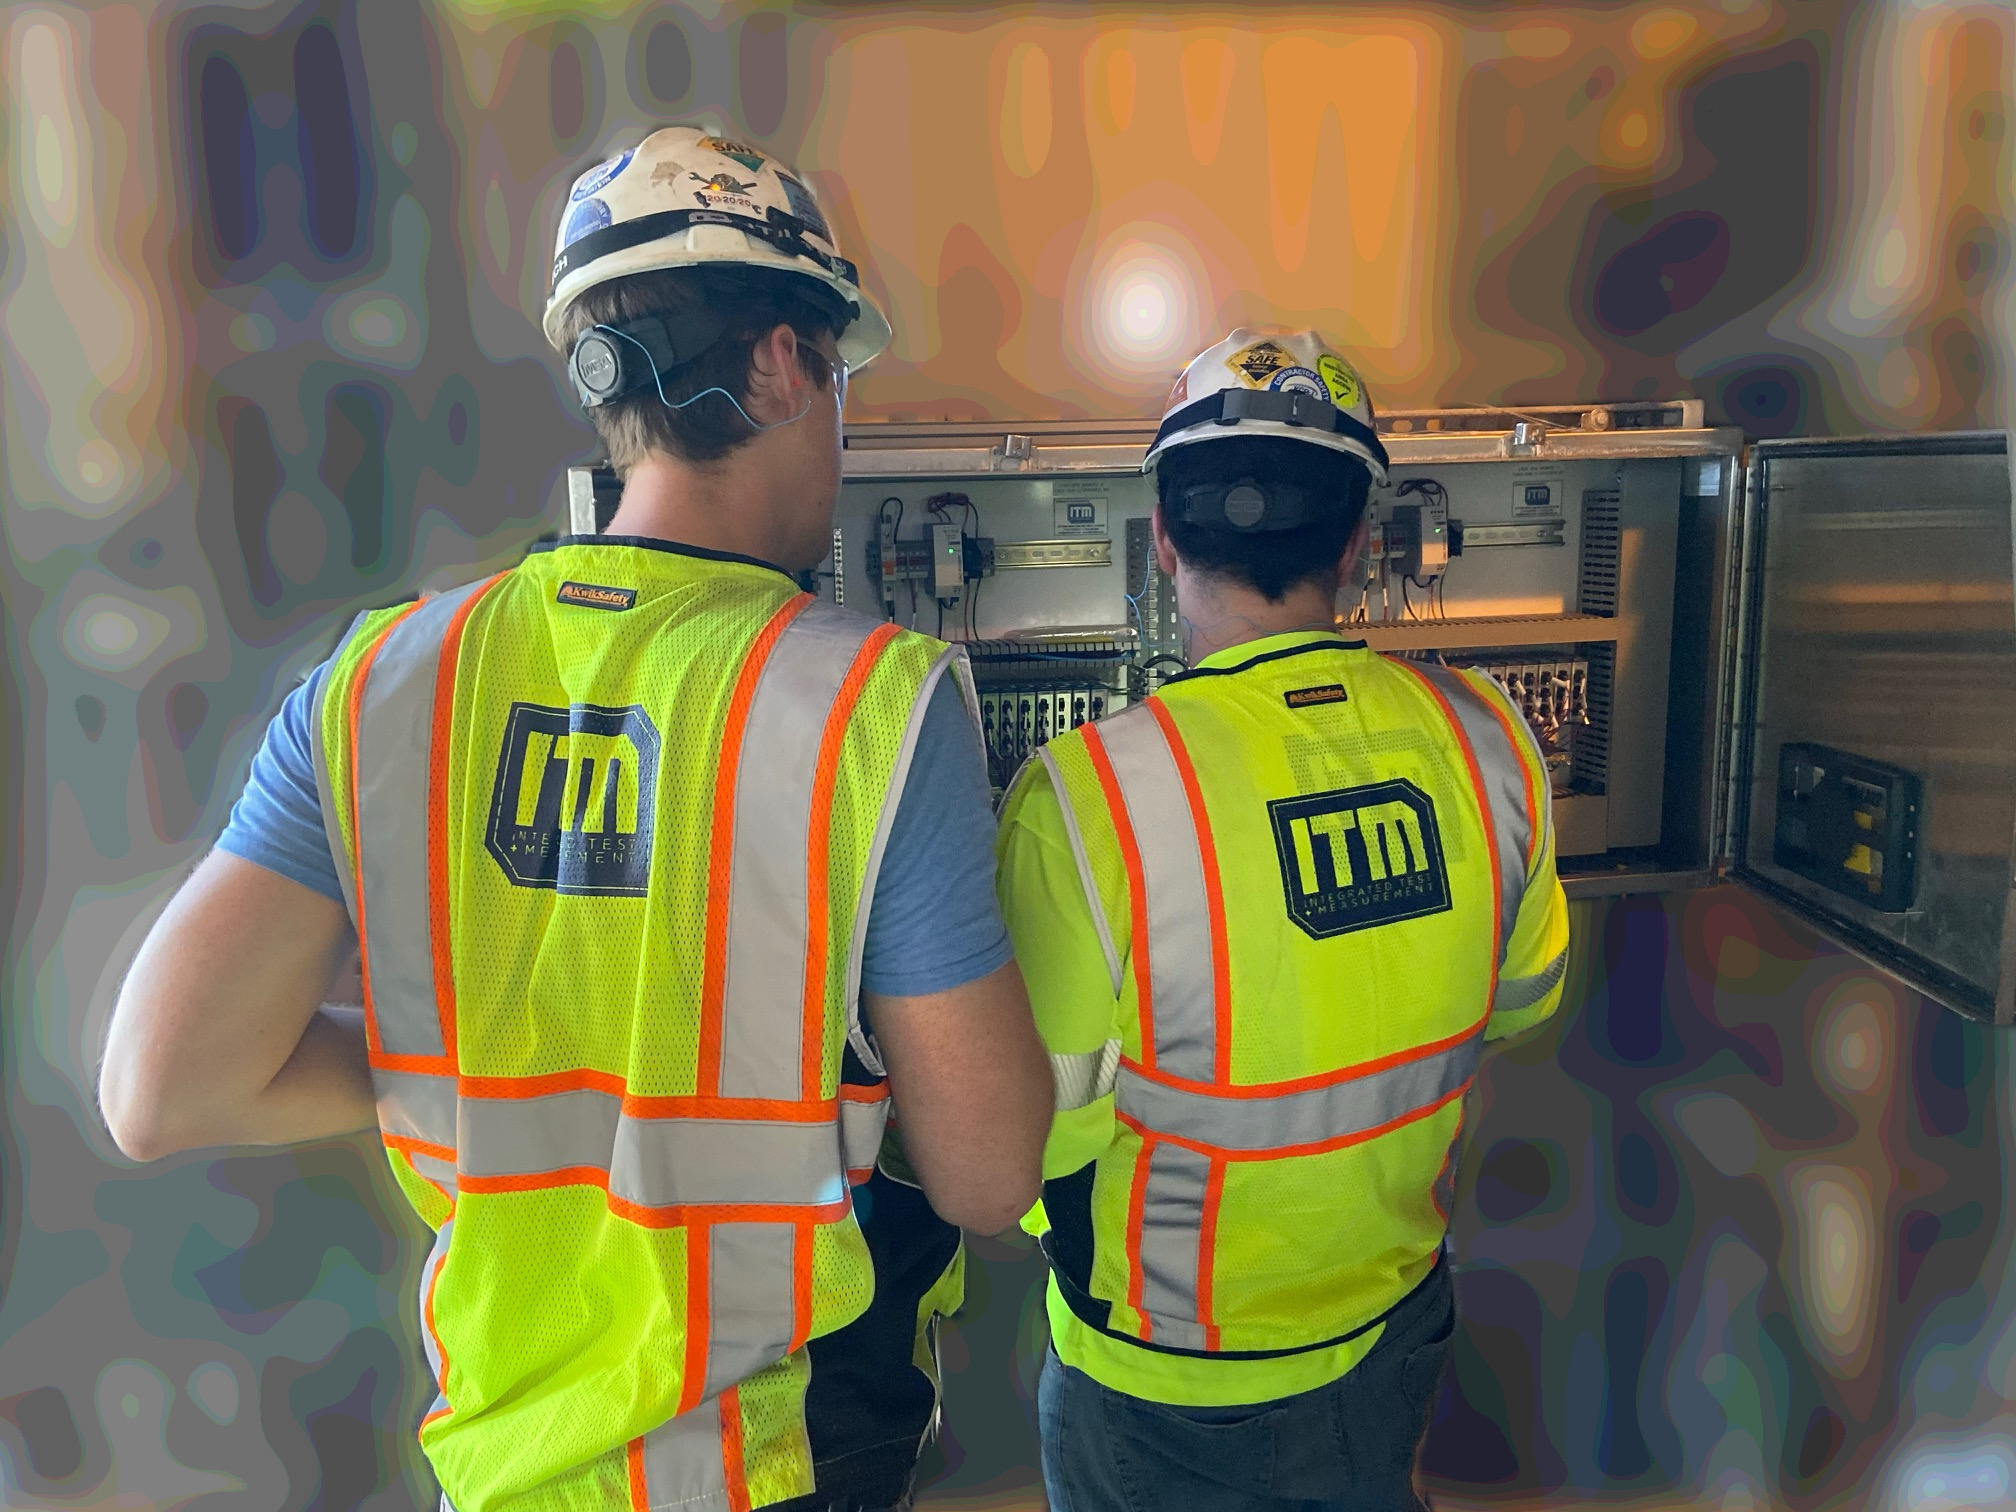
Last week our team successfully and safely installed another Boiler Monitoring System (BMS). This system, a Sootblower Fouling Detection (SFD) system, monitors structural and vibration sensors that quantify the boiler’s response to sootblower operations. The SFD system analyzes the boiler response data and outputs Key Performance Indicators (KPIs) such as fouling level, sootblower efficiency, and sootblower health to automated boiler cleaning systems.
This boiler uses over 50 sootblowers located at different elevations to clean soot build-up from boiler steam tubes. Since the vibration measurement locations are relatively far apart, the SFD system requires a distributed monitoring system consisting of several junction boxes that monitor and process data for groups of sensors. One team of engineers mounted the vibration sensors to the sootblowers and confirmed communication back to a local junction box containing the National Instruments condition monitoring hardware. The other team installed the junction box panels and terminated the sensor cables.
After all the sensor installations and terminations were completed, each sensor’s location and calibration were verified. While the sensor verification was being completed, one engineer worked with the mill IT department and the controls engineer to establish remote connection to the system and confirm communication with the mill’s automated cleaning system.
After commissioning the system and returning to our home base, our engineers are now monitoring the system through a VPN connection and assisting boiler operators with optimizing their cleaning process.
For more information about our ryan.welker@iTestSystem.com or phone @ 1.844.837.8797 x702
Over the years we have been tasked with identifying the root cause of machine structural failures. In many cases, we can determine the failure mode through strain and vibration testing, order analysis, modal analysis, and operating deflection shape analysis. What tests can you run when the damaging conditions are intermittent and not easily identified?
In these cases, we like to install a cellular networked temporary data acquisition (DAQ) system that can autonomously log vibration and strain data along with machine status data. We have deployed two types of DAQ systems to collect data remotely. An interactive system that includes an industrial PC running our iTestSystem software and National Instruments (NI) Compact DAQ hardware and a headless system that utilizes NI Compact RIO hardware. Our test engineers prefer using the interactive solution for troubleshooting because they can view real-time signal waveforms and collected data files, and then adjust the test parameters accordingly without having to reprogram the hardware.
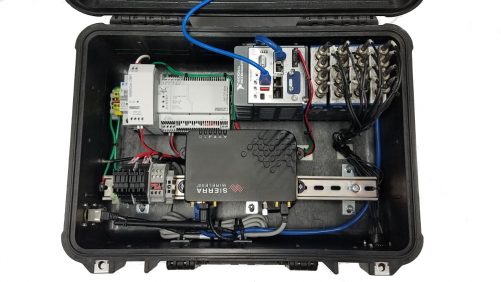
When potentially damaging events are identified in the vibration and strain data collected by these systems, it is important to know the machine’s operating status. Collecting the machine status information is just as important as collecting the structural data. Many machines transmit these operating variables and operating stages over their network/bus. Recently we have recorded process data from Allen Bradley Control Logix PLCs via Ethernet/IP, mining machine data from a Siemens controller via proprietary TCP/IP protocol, boiler condition data from a DCS via Modbus TCP, machine pressures from PI historian via the UFL connector (TCP), and vehicle speeds and pressure via CAN. Fortunately, we were able to use and adapt LabVIEW communication protocol tools to build applications and addons that allow this network tag data to be collected along with structural data.
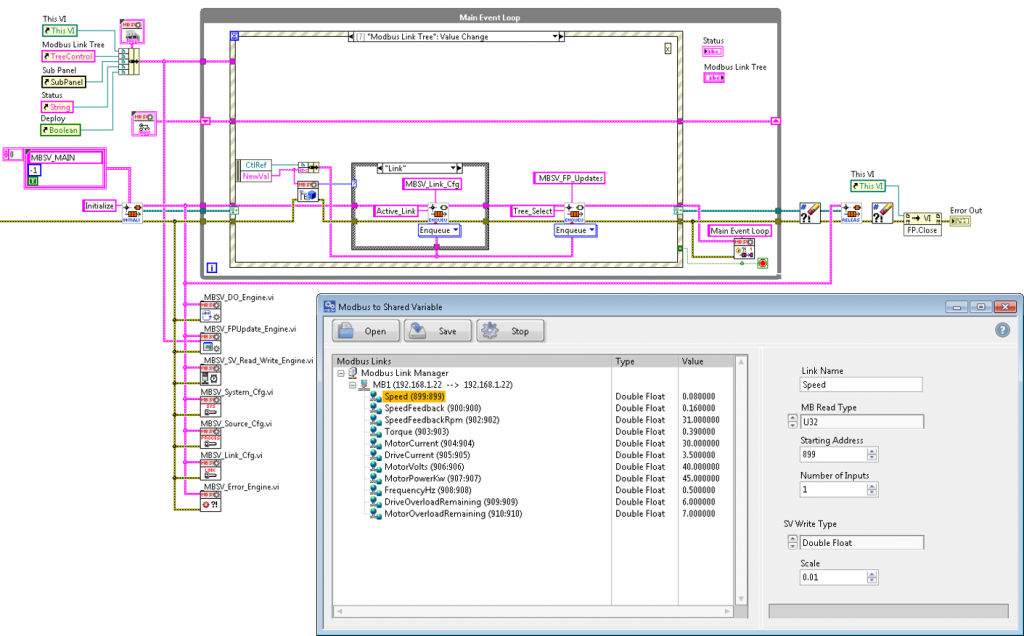
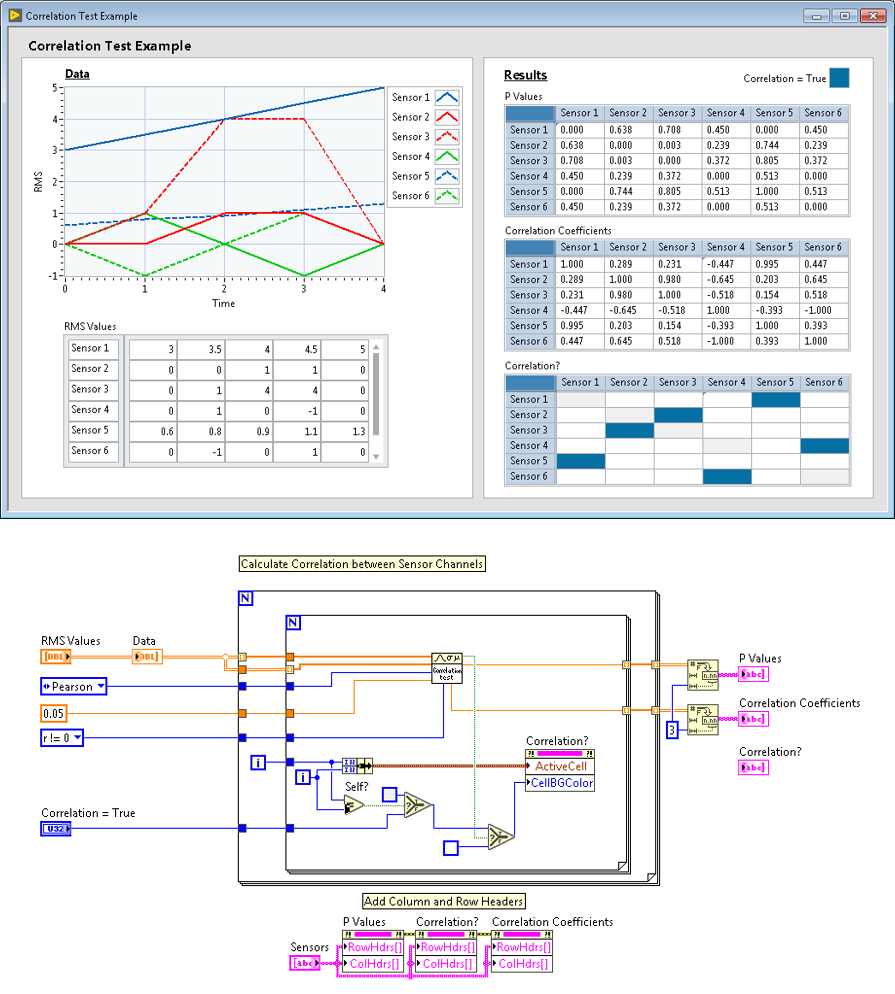
After the data collection phase, our engineers perform statistical analysis on the sensor and status channels in all data files and aggregate the results into a database for searchability. To identify the root cause probabilities, you can process the channel statistics data using your favorite correlation algorithm or application. The image below shows an example data set containing related sensor data that was processed using a LabVIEW correlation test tool.
Contact Information: For more information about our remote data acquisition service, our LabVIEW development service, or iTestSystem contact:
Mark Yeager – Integrated Test & Measurement (ITM), LLC. Email: mark.yeager@itestsystem.com or Phone: 1.844.TestSys
Recent News: Ohio University Asphalt Cracking Prediction System Project
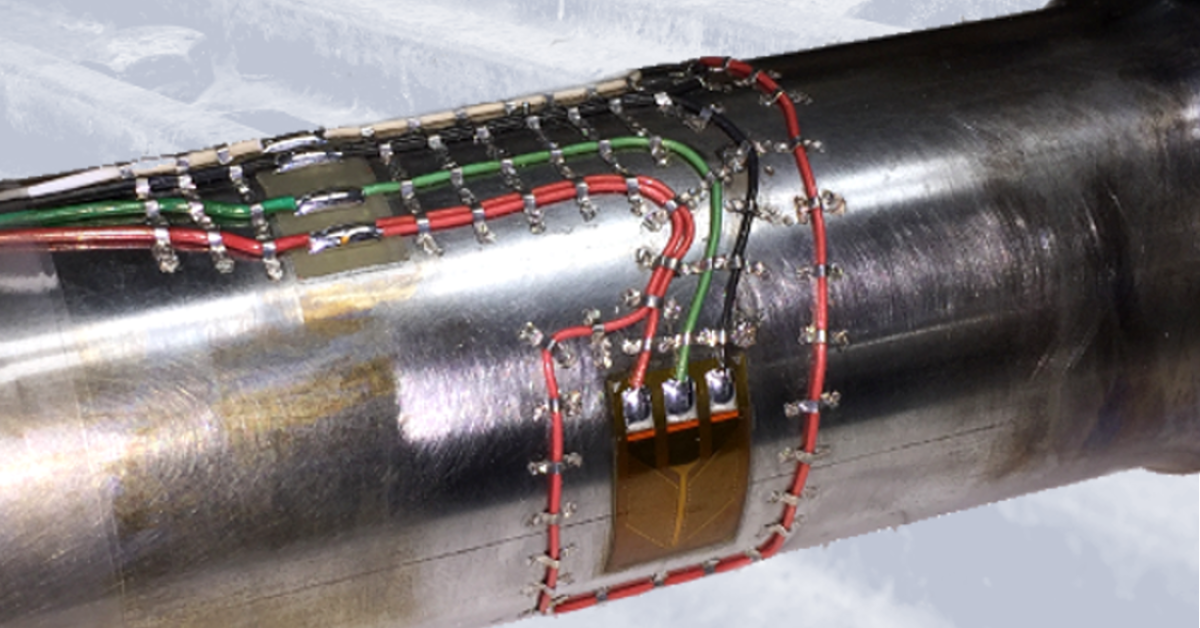
Image1: Shaft torque strain gauge installation example for field testing
Our engineers and technicians have epoxied, soldered and spot welded strain gauges for applications ranging from high temperature exhaust systems to miniature load cell measurements. Every application requires a unique understanding of the strain measurement requirements including installation environment.
If the strain gauge installation is to survive in the field you must plan for the conditions it will undergo. Three important variables that you should account for are temperature range, liquid exposure, and potential impact forces. These variables determine the type of strain gauge, epoxy, solder, wiring, coating, and impact/wear protection to use in the application. The table below shows which variables affect your installation choices.
| Gauge | Epoxy | Solder | Wiring | Coating | Covering | |
| Temperature | ||||||
| Liquid Exposure | ||||||
| Impact Forces |
Table1: Strain gauge installation variables
For more information about ITM’s strain gauging services contact Ryan Welker at email: ryan.welker@itestsystem.com or phone: 1.844.837.8797 x702
When we develop LabVIEW™ applications for our customers, a common request is for a simple, resizable and intuitive user interface (UI) for data visualization. In these cases, we use a tree control and a subpanel. This type of UI functions like a tab control that automatically resizes. The main benefit of using a subpanel is to make your code more modular.
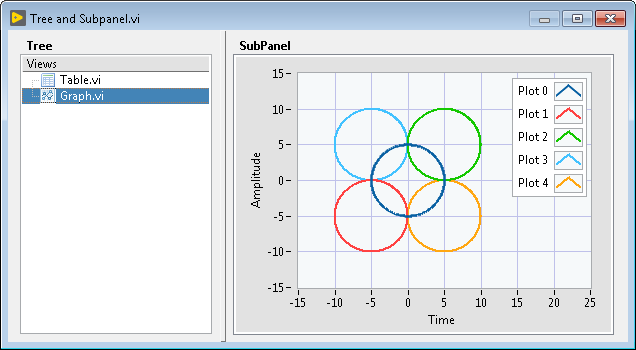
To illustrate the modularity that this type of UI creates, I made an example LabVIEW™ project. The main VI shown above uses a tree control to switch between a VI containing a graph and a VI containing a table. I used our multi-queue event architecture for VI information communication messaging. The image below shows the main VI’s significant functions.
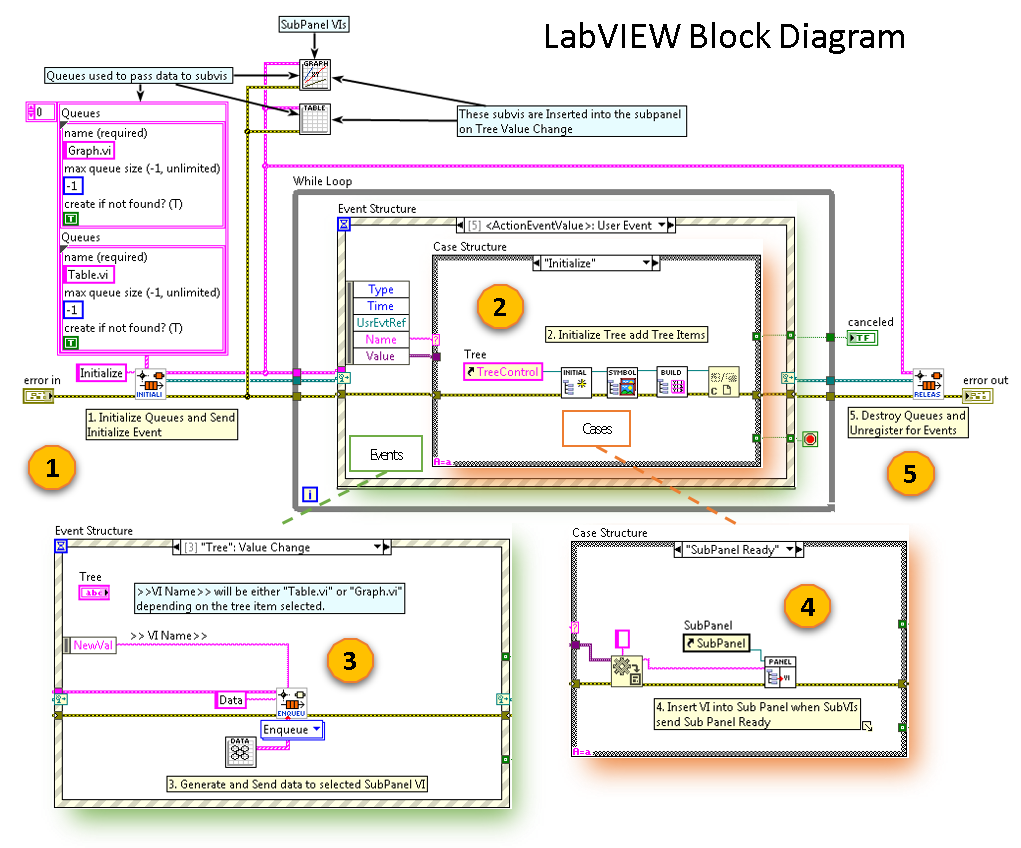
The main VI’s functions are listed below.
Functions
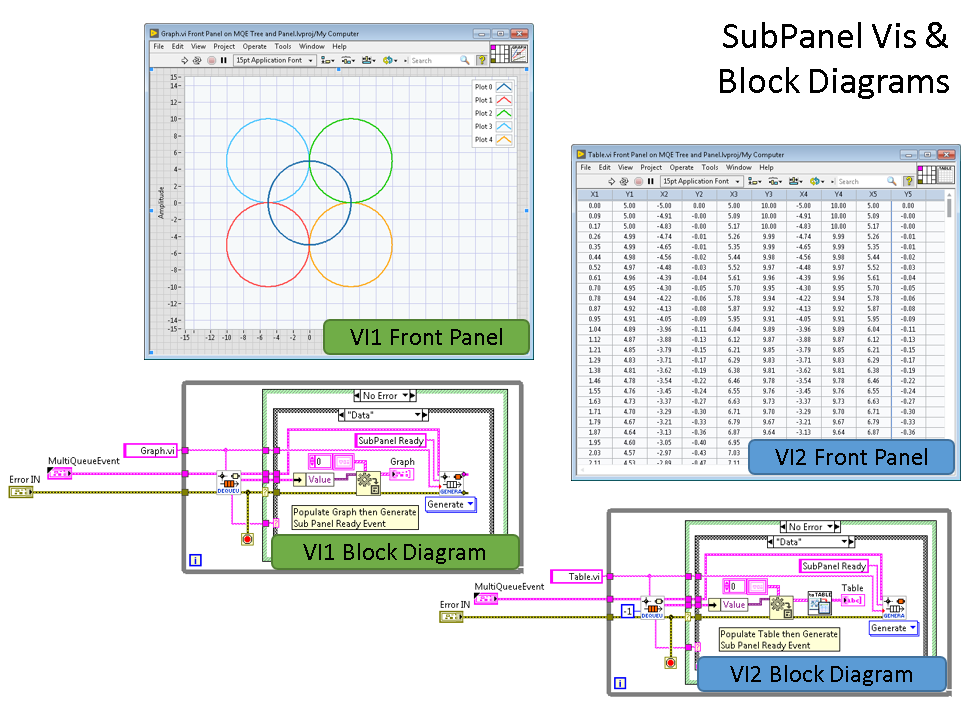
In this example the subpanel VIs are very simple. They populate an indicator (table or graph) and then generate a SubPanel Ready Event. The two (2) subpanel VIs and block diagrams are shown below.
Contact Information: For more information on this example or our LabVIEW development service contact:
Mark Yeager – Integrated Test & Measurement (ITM), LLC. Email: mark.yeager@itestsystem.com or Phone: 1.844.TestSys
Integrated Test & Measurement (ITM) is presenting its patented Sootblower Fouling Detection (SFD) technology at the Spring 2019 Black Liquor Recovery Boiler Advisory Committee (BLRBAC) meeting in Atlanta, GA on Wednesday, April 10, 2019.
ITM’s SFD system effectively offers the following benefits to boiler operations:
Find out more about ITM’s Sootblower Fouling Detection (SFD) system and other Boiler Monitoring Solutions at https://itestsystem.com/solutions/industrial-monitoring-systems/
Conference details can be found at http://blrbac.org/meeting-registration
Have questions? Contact Tim Carlier @ Tim.Carlier@iTestSystem.com

The tool we most commonly use for real-time embedded process monitoring and control applications is the NI CompactRIO. These controllers allow us to embed algorithms that acquire and analyze high speed process sensor data and then output derived key performance indicators (KPIs) to other control systems. Most of the time, our customers also require us to send the KPIs to a real-time data infrastructure like OSIsoft’s PI System so plant managers and engineers can use the data to find energy savings, monitor asset health, or optimize processes.
For our latest CompactRIO systems we have developed APIs that allow us to send or receive data directly to/from PI. We utilize the PI Asset Framework and the UFL Connector to automatically generate PI tags from the device and update the process tag values either on value change or on a time basis.
These tools greatly simplify our CompactRIO to PI System communication process by eliminating intermediary data servers and automatically generating PI tags based on a CompactRIO system’s configuration. If you are interested in using these APIs for PI or developing a CompactRIO system contact Mark Yeager or Chase Petzinger.

ITM provides software development, structural and mechanical testing services, industrial monitoring, strain gauging, and data analysis solutions to clients on six continents. ITM is a recognized National Instruments Gold Alliance Partner.
![]()